
What apartments cost in Lexington right now, and which figure to trust
The HUD figure above is not an average. It is a 40th-percentile gross rent estimate, calculated from 2019 to 2023 Census American Community Survey data and trended forward, and it exists to set HUD’s Fair Market Rent voucher payment standards, not to describe a typical listing. Lexington’s Affordable Housing Needs Analysis, published by the Lexington-Fayette Urban County Government in November 2024, is closer to a general-market figure: a $1,104 median rent, drawn from EHI Consultants’ study of the local market, with rents up 47% between 2019 and 2024.
| Unit type | HUD FY2026 FMR | Avg. size (Yardi Matrix, May 2026) | FMR per sq ft |
|---|---|---|---|
| Studio | $883 | 434 sq ft | $2.03 |
| 1 bedroom | $1,079 | 701 sq ft | $1.54 |
| 2 bedroom | $1,272 | 1,006 sq ft | $1.26 |
| 3 bedroom | $1,743 | 1,312 sq ft | $1.33 |
| 4 bedroom | $1,940 | — | — |
Rent per square foot drops through the two- and three-bedroom tiers and does not recover, which is the concrete argument for renting up a bedroom size if two more roommates are available: the marginal square foot gets cheaper up to three bedrooms, then plateaus.
Is Lexington’s rental market cheaper than the national average, and by how much? Zillow’s market-trends page puts Lexington rent 17% below its national figure; HUD’s FY2026 two-bedroom FMR of $1,272 sits well under the national FMR baseline used for the same program. Both sources agree on direction, even where they disagree on the exact citywide number.
What this page is, and isn’t
This page is a sourced market snapshot, not a live listings feed: it will not show which specific unit is available today. The rent figures above are point-in-time, current as of the sources’ publication dates named next to them, and will drift as new leases sign. For live inventory, a marketplace search is still the right tool; this page is for understanding what the numbers you’ll see there actually mean.
Rent by neighborhood, and why the gap exists
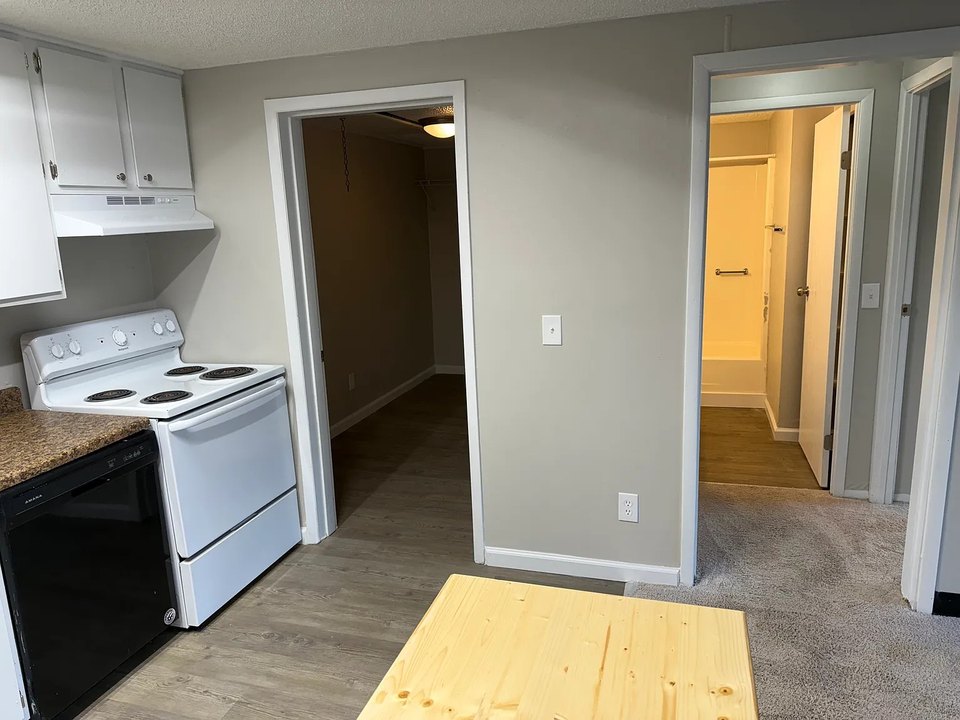
The gap between Lexington’s cheapest and priciest rentals traces to three variables: distance from the University of Kentucky campus, the age of the housing stock, and whether a submarket has seen recent construction.
Near UK and Central Lexington
Neighborhoods like Kenwick, Chevy Chase, and the area immediately around campus carry a premium tied to walkability and university turnover demand. Older housing stock here mixes with student-oriented rentals, which compresses supply during the academic year.
Hamburg and Beaumont Centre
Both submarkets sit on the outer ring, built out largely after 2000, and price closer to new-construction rates: larger floor plans, structured amenities, and a car-dependent location near I-75 and the airport corridor.
Older, lower-turnover submarkets
Areas with housing stock built in the 1970s through 1990s, per the same LFUCG analysis, tend to price below the citywide median simply because unit age and amenity level lag newer product, independent of location quality.
| Submarket cluster | Primary price driver | Best fit for |
|---|---|---|
| Near UK / Central (Kenwick, Chevy Chase) | Walkability, university turnover demand | Students, staff, short leases |
| Hamburg / Beaumont Centre | New construction, larger units, car-dependent location | Families, remote workers wanting space |
| Older 1970s–90s stock, outer submarkets | Lower amenity level, aging housing stock | Budget-focused renters, long-term leases |
The driver that repeats across every cluster is not location alone: it is the interaction of location with building age, since a 1975-built unit two blocks from a 2024-built one in the same neighborhood can rent for a meaningfully different amount.
Do I need a car to live in Lexington without a rental car? Near-campus and downtown-adjacent units support car-light living through Lextran’s transit network and the Legacy Trail; Hamburg, Beaumont Centre, and most outer submarkets don’t have comparable transit density, and a car becomes close to mandatory for a normal commute.
What’s driving the Lexington rental market
LFUCG’s 2024 needs analysis puts the city’s housing gap at 22,549 units of all types, with 17,005 of those needed specifically for households at or below 80% of area median income ($62,908). That gap is the clearest available signal of undersupply relative to demand, and it’s the number an investor should weigh more heavily than any single marketplace rent figure.
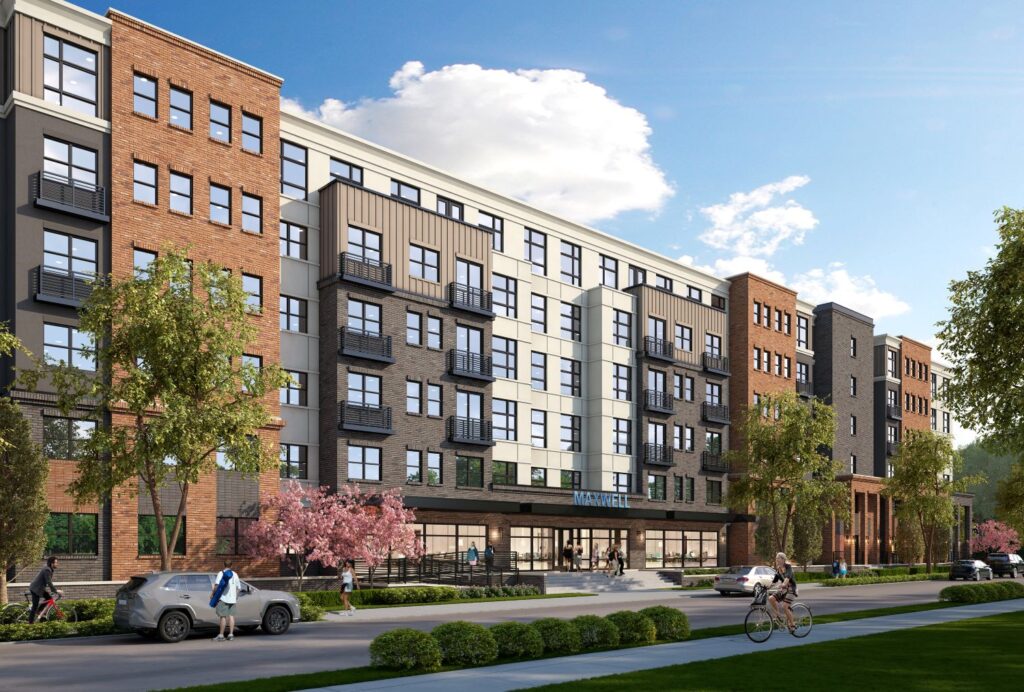
On the supply side, new delivery is happening but slowly relative to that gap. The Landing at Lakewood Harbour, a 101-unit, $30 million mid-rise near Chevy Chase on Laketower Drive, opened in June 2025 with 50 one-bedroom and 51 two-bedroom units renting from roughly $1,900 to $3,000. It is one data point, not a trend line, but it illustrates the price tier new construction is landing at, well above both the HUD FMR and the LFUCG median.
Leasing seasonality
University of Kentucky enrollment hit a record 38,719 students in Fall 2025, with roughly 8,100 living on campus and a new residence hall opening the following year. That leaves the large majority of UK’s student body renting off campus, and turnover concentrates in a narrow window: leases near campus cluster around May to August move-outs and move-ins, tied to the academic calendar rather than the calendar year.
When do the most units become available in Lexington? Near-campus submarkets see the heaviest turnover between May and August, tied to the university’s academic calendar; submarkets away from UK don’t show the same concentration and list more evenly through the year.
For renters: what to check before you sign

- Income multiple. Most Lexington property managers ask for gross income at three times the monthly rent; run that math against whichever of the two sourced rent figures above matches your target unit type before you tour.
- Deposit norms. A security deposit equal to one month’s rent is standard locally; some properties near campus request a second deposit or a co-signer for first-time renters without prior lease history.
- Screening timeline. Background and credit checks commonly add three to five business days before a lease is offered, longer if a co-signer is involved.
- Commute cost against rent savings. A cheaper outer-submarket unit can lose its savings entirely once a second car payment or added commute time is priced in; run that math before choosing the cheapest listing on paper.
What income do I need to comfortably afford rent in Lexington? On the LFUCG-reported area median income of $62,908, a household spending the standard 30% cap on housing has roughly $1,572 a month available for rent, above every HUD FMR tier through three bedrooms.
For investors, landlords, and agents: reading the same data the other way

| Data point | What it means for a renter | What it means for an owner or agent |
|---|---|---|
| 22,549-unit housing gap (LFUCG, 2024) | Expect continued competition for available units and slower rent relief | Structural undersupply supports rent growth and low vacancy risk over the medium term |
| 47% rent increase, 2019–2024 (LFUCG) | Budgeting should assume rents keep outpacing general inflation | Existing holdings have likely outperformed a simple CPI-indexed rent model |
| The Landing at Lakewood Harbour, $1,900–$3,000 rents (June 2025) | New-construction product prices well above the citywide median | New-build rents at this level signal what achievable rent looks like for ground-up development in premium submarkets |
| UK’s record 38,719 Fall 2025 enrollment, ~8,100 on-campus | Near-campus supply stays tight; book a lease early if that location matters | Near-UK holdings carry a demand floor that submarkets farther out lack |
The gap between the LFUCG figure and the marketplace averages by itself does not answer whether Lexington rents keep rising at the 2019–2024 pace; it only establishes that undersupply, not sample noise, is driving the trend.
Is now a good time to buy a rental property in Lexington’s apartment market? The 22,549-unit supply gap and 47% five-year rent growth both point toward continued upward pressure on rents, which favors buy-and-hold over a quick flip; nothing in the sourced data here addresses financing costs or a specific property’s condition, both of which matter more to that decision than the market-level numbers.
Common mistakes and edge cases
- Dropping an unsourced average into a negotiation or an investment memo. A landlord or lender can ask which figure and which date a rent number came from; citing HUD’s FY2026 FMR or LFUCG’s 2024 median holds up under that question in a way a marketplace homepage number doesn’t.
- Assuming near-campus pricing applies citywide. Kenwick and Chevy Chase premiums don’t transfer to Hamburg or the outer submarkets, and vice versa for the seasonal turnover pattern.
- Treating student-heavy submarkets as representative of Lexington’s overall vacancy rate. Near-UK turnover concentrates in a few months; the rest of the market doesn’t follow the same calendar.
- Skipping the AMI math on affordable-housing-adjacent units. Some newer developments, including LFUCG-backed projects, restrict eligibility to households under 80% of the area median income; check eligibility before assuming a listed “affordable” rent applies to any renter.
Comments