
What a Madison apartment costs right now
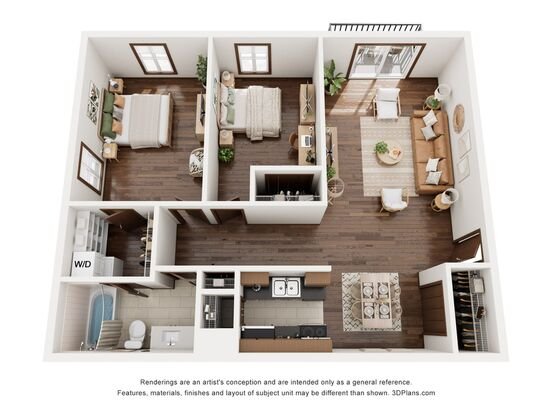
Market-rate trackers built from large, professionally managed buildings post the highest figures. HUD’s federal benchmark posts the lowest. The true citywide market, most of which is smaller and older buildings, sits closer to HUD’s number than to either private tracker’s.
| Bedroom type | RentCafe (June 2026) | Zillow Rental Manager (current) | HUD FY2026 FMR |
|---|---|---|---|
| Studio | $1,288 | $1,225 | $1,268 |
| 1 Bedroom | $1,580 | $1,395 | $1,482 |
| 2 Bedroom | $1,964 | $1,750 | $1,694 |
| 3 Bedroom | $2,700 | $2,495 | $2,236 |
RentCafe’s figures come only from buildings with 50 or more units, a slice of the market skewed toward newer construction with higher finishes. HUD’s Fair Market Rent instead measures the 40th percentile across every rental unit in Dane County, older duplexes and basement apartments included, which is why it lands below RentCafe on every bedroom size. Zillow’s number sits closer to HUD’s because its inventory mixes large and small buildings. None of the three figures is wrong; each is measuring a different population of units.
Is Madison rent going up or down right now? It depends on the tracker: RentCafe shows a 2.65% increase over the past year, Zumper shows about a 1% decrease. Both can be true at once because they sample different buildings, but the citywide direction from the city’s own planning data is deceleration: regional rent growth slowed from 2.5% to 1.4% year over year as vacancy rose from 5.9% to 6.2% in 2025.
Where the price splits by neighborhood

A one-bedroom in Madison’s cheapest neighborhood costs about $1,650 less than one in its priciest, and proximity to the isthmus explains most of that gap.
| Area | 1BR average | Trade-off | Transit / access |
|---|---|---|---|
| Mayfair Park | $825 | Far west side, most affordable stock, longest commute to campus and downtown | Bus-dependent, no isthmus walkability |
| Near East / Sheridan Triangle | $941 | Older housing stock east of downtown, budget rents close to the isthmus | On core bus routes, bikeable to downtown |
| State Street | $995 | Small, older units directly on campus and adjacent to downtown | Most walkable and bikeable block in the city |
| Spring Harbor | $995 | Near-west lakefront, quieter than State Street at the same price | Good bike access, thinner bus coverage than downtown |
| Tenney-Lapham | $2,475 | Isthmus neighborhood between both lakes, walk to the Capitol, premium for location | Excellent walk and bike access, light car dependence |
The premium is almost entirely about the isthmus: Tenney-Lapham sits between Lake Mendota and Lake Monona within walking distance of the Capitol, while Mayfair Park sits several miles west with no comparable walk score. Renters who need car-free access to downtown or campus pay for it; renters who don’t can save $1,000 or more a month by moving a few miles out.
For context, Wisconsin’s WHEDA capped monthly rent for income-restricted units serving 80%-AMI households in Madison at $2,078 in 2025, a ceiling that sits above the average market rent for the city’s more affordable rental tiers.
Which Madison neighborhood is actually cheapest? Mayfair Park, at roughly $825 for a one-bedroom. Near East and Sheridan Triangle follow close behind at $941.
Madison against Dane County’s suburbs
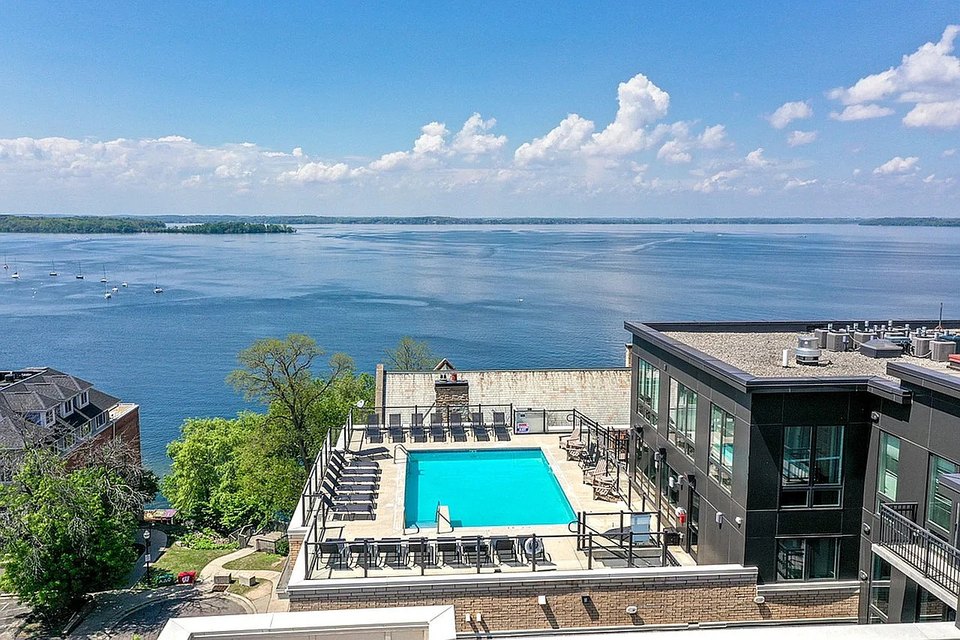
Middleton undercuts Madison on every bedroom size by $100 to $200 a month, while Verona, home to Epic Systems’ campus, now costs more than Madison itself.
| City | Studio | 1BR | 2BR | 3BR | Source |
|---|---|---|---|---|---|
| Madison | $1,288 | $1,580 | $1,964 | $2,700 | RentCafe, June 2026 |
| Middleton | $1,065 | $1,478 | $1,754 | $1,882 | RentCafe |
| Verona | $1,405 | $1,721 | $2,189 | $2,939 | RentCafe, March 2026 |
| Fitchburg | $1,263 | $1,479 | $1,853 | $2,679 | Rentometer, June 2026 |
Fitchburg’s figures come from Rentometer instead of RentCafe, the only suburb here without matching large-building inventory for a like-for-like read; treat its column as directionally consistent with the others, not exactly comparable unit for unit. Verona’s premium over Madison, roughly $140 more for a one-bedroom and $225 more for a two-bedroom, reflects new construction built around Epic’s campus. Middleton offers Madison-adjacent schools and a shorter commute for less money on every unit size, the opposite of what many renters expect from a wealthier suburb.
Which Madison-area suburb is actually cheapest? Middleton, on every bedroom size, despite its school-district reputation. Verona now costs more than Madison proper, driven by demand from Epic Systems employees.
What moves Madison rent: UW–Madison’s August squeeze and new supply
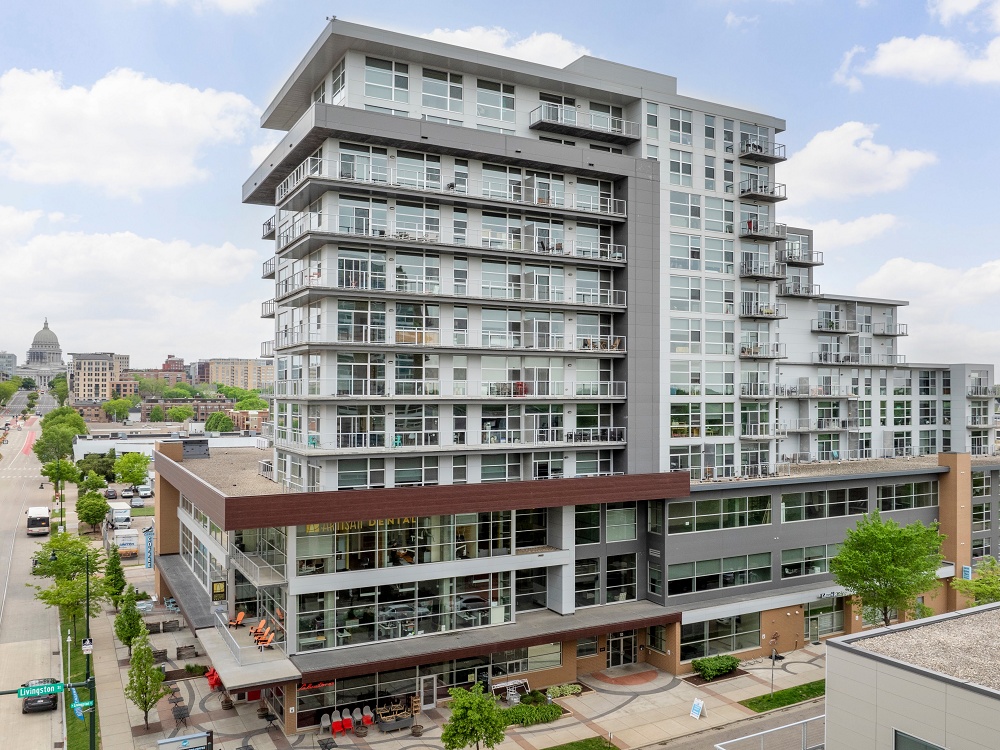
Most off-campus leases near UW–Madison start in mid-August, and landlords begin advertising fall vacancies as early as October and November of the prior year.
University Housing blocks routine apartment transfers between May 1 and September 30 so its turnover staff can prepare units before the fall semester begins, and residents who are graduating must vacate by August 31. Off campus, the same calendar dominates: competitive near-campus units are typically gone six to nine months before the semester starts, which is why a serious search near campus has to begin nearly a year ahead of the actual move-in date.
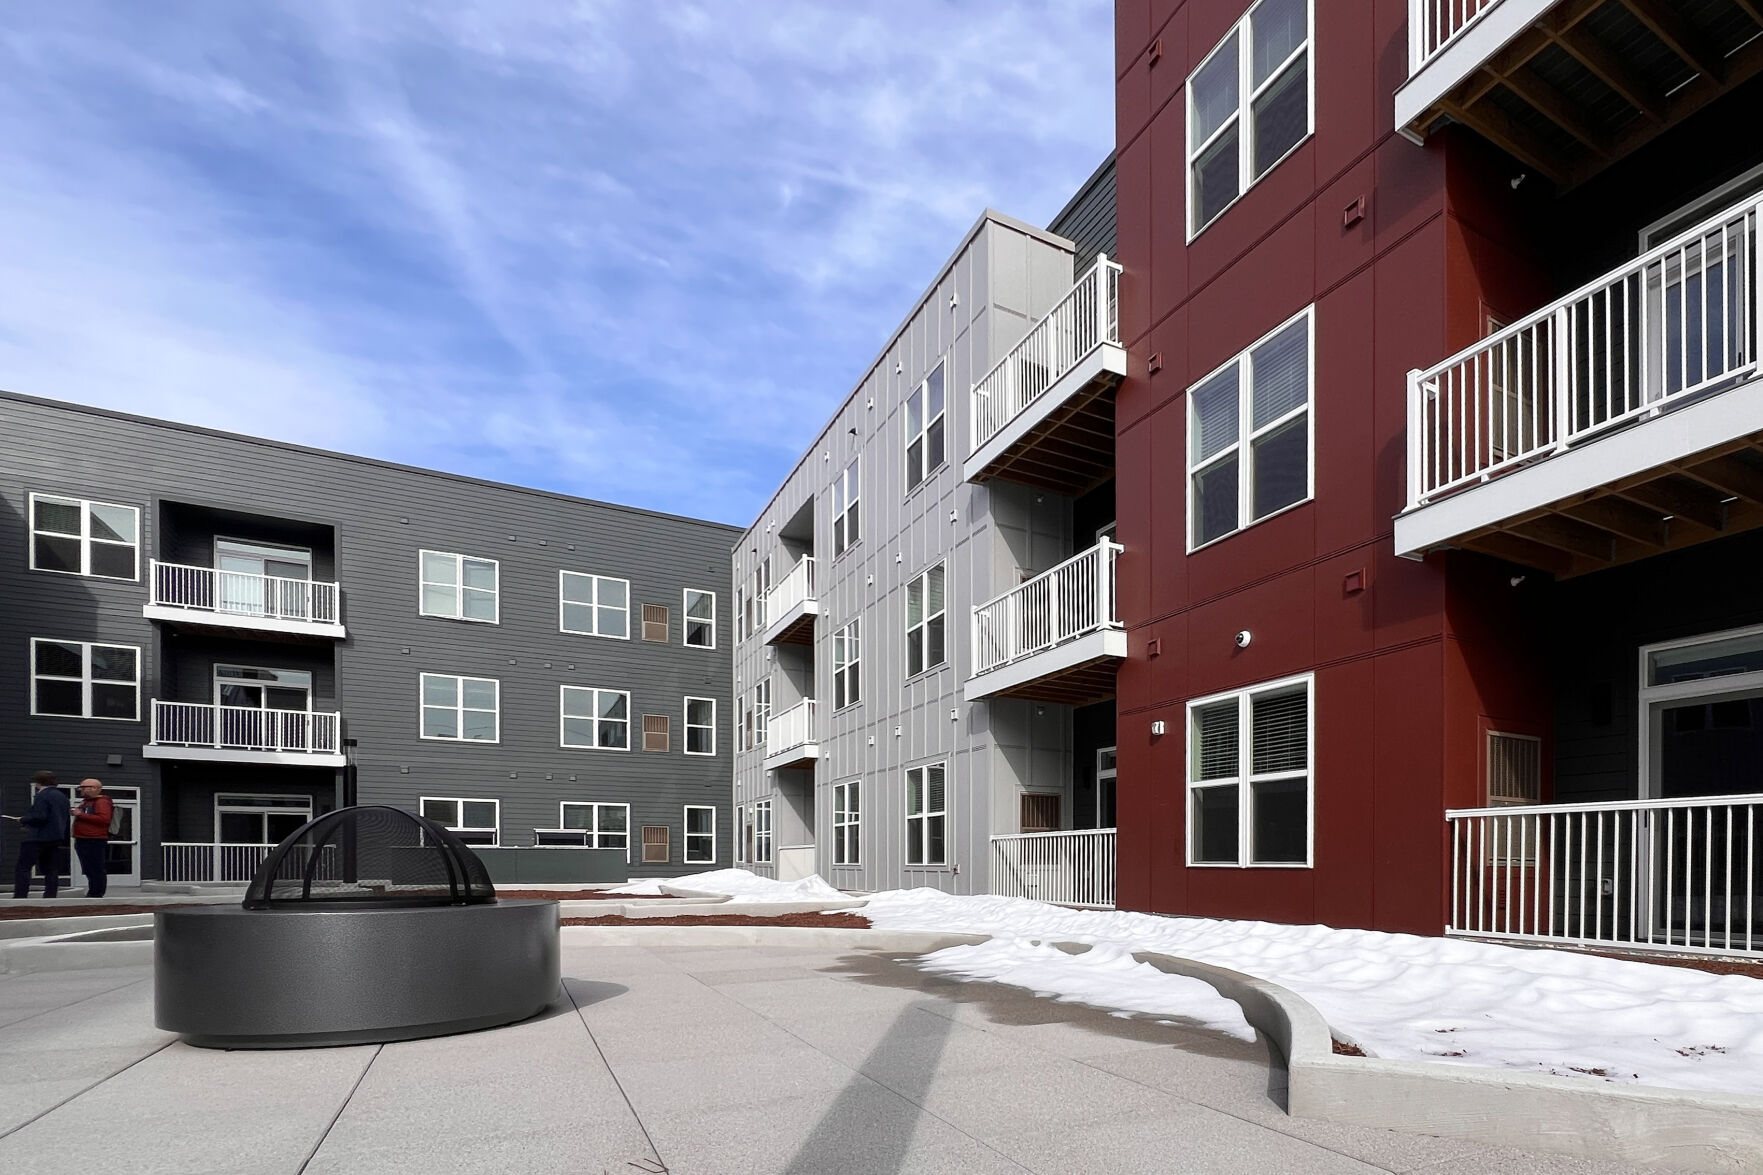
The other side of the squeeze is new supply. The city added 1,202 new housing units in 2025 with roughly 5,000 more in the development pipeline, and the wider Madison metro added a net 2,802 multifamily units in 2025 alone, a 2.8% increase to the regional stock.
When do most Madison leases turn over? Mid-August, timed to UW–Madison’s fall semester start around August 15. Near-campus units list as early as October and November for the following fall, and by spring most of the desirable inventory close to campus is already leased.
Getting around Madison without a car
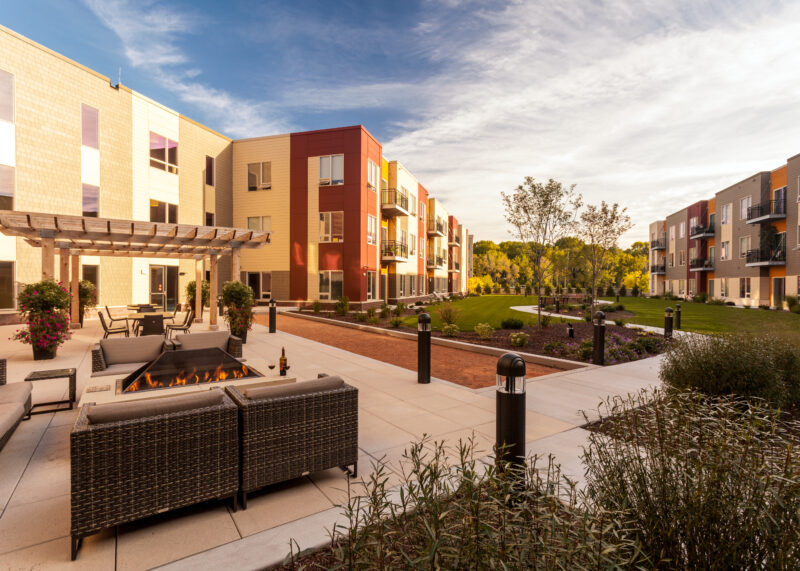
Metro Transit’s core routes cover downtown, the isthmus, and the UW–Madison campus reasonably well, with a monthly pass running about $52.50, though suburban and late-night coverage thins out fast. More than 200 miles of connected paths, including the Capital City Trail and the lakeshore routes, make biking a realistic year-round option for much of the isthmus and near west side. Census-derived housing data for Madison puts one in five renter households at zero vehicles, while just over half keep one car and a quarter keep two.
Do I need a car to live in Madison? Not necessarily on the isthmus, near campus, or on a core Metro Transit route, where the network and bike paths cover things well. Outside downtown, especially in the suburbs, thin suburban and late-night service makes a car close to essential.
How Madison compares statewide, and the vacancy signal to watch
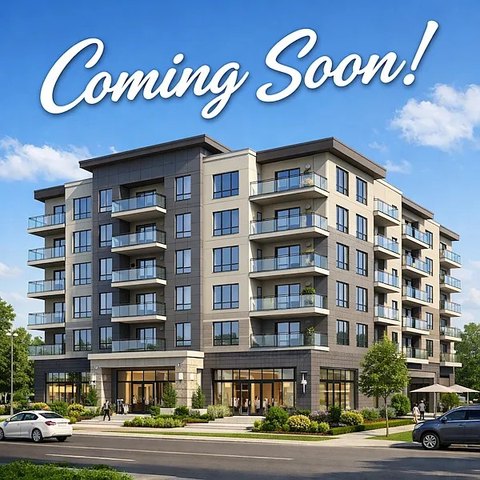
Dane County carries the highest Fair Market Rent of any Wisconsin county, about 70% above the state’s 1-bedroom average of $872. That statewide comparison uses HUD’s methodology consistently across all 72 counties, a cleaner cross-market yardstick than comparing self-reported averages from different private trackers.
| Source | Reported 1BR figure | Date / methodology |
|---|---|---|
| Apartments.com | $1,522 average, $69,000 income suggested | No date or methodology stated on the page |
| RentCafe / Yardi Matrix | $1,580 | June 2026, buildings of 50+ units only |
| Zillow Rental Manager | $1,395 | Current listing data, all building sizes |
| HUD FY2026 Fair Market Rent | $1,482 | 40th percentile of all Dane County rental stock, published federal methodology |
For budgeting a market-rate lease, the RentCafe or Zillow range is the more useful figure. For anything tied to a housing voucher, income limit, or HOME/Section 8 program, only the HUD number matters, since that’s the figure local housing authorities actually apply.
The more decisive number for renters right now is the vacancy split by building tier: Madison’s newer, higher-amenity buildings run 6% to 7% vacant, while its older, more affordable buildings sit tighter at 4.6%. Budget-conscious renters are competing over a smaller pool of open units than renters willing to pay for new construction, the inverse of what the citywide 4.8% average suggests on its own.
Comments