
Why the Numbers You’ll See Elsewhere Don’t Match
Four independent trackers cover Tewksbury and none of them are measuring quite the same thing.
| Tracker | Metric | Period | Value | Basis |
|---|---|---|---|---|
| Redfin (city page) | Closed sale price | May 2026 | $705,578 | MLS sales, town |
| Redfin (market page) | Closed sale price | October 2025 | $653,000 | MLS sales, town, 26 sales that month |
| Homes.com | Trailing 12-month sale price | Through April 2026 | $667,000 | MLS sales, town |
| Movoto | Active list price | July 2026 | $699,000 | Active listings, town |
A closed sale price and an active list price answer different questions: one tells you what buyers actually paid, the other tells you what sellers are currently asking. Redfin’s own two numbers a few months apart show something else too. Tewksbury sells around 26 to 30 homes a month, and a sample that small can swing a reported median 8% in either direction without any real shift in the underlying market. Treat a single month’s headline figure as noisy, and the trailing-12-month number as the steadier read. The most common mistake buyers make is comparing a list-price figure from one site against a sale-price figure from another and assuming the gap is negotiating room, when it may just be two different metrics.
Why do different websites show different median prices for Tewksbury? Because they measure different things: closed sale price versus active list price, a single month versus a trailing year, and the town versus the wider 01876 zip. None of the four figures above is wrong; they answer different questions.
Is This a Buyer’s or Seller’s Market Right Now
Redfin classifies Tewksbury as “most competitive,” reporting an average of five offers per home and sales closing around 2% above list price within roughly 20 days. That classification runs on Redfin’s Compete Score, a 0-to-100 index the company doesn’t publish a full methodology for, so treat the label as directional rather than a precise measurement.
What This Means If You’re Selling
The May 2026 sale-price read (+11.1% YoY) and sub-three-week typical timelines both favor listing now, provided the property is priced against the trailing 12-month figure ($667,000) rather than the most recent single-month print, which can run hot or cold.
What This Means If You’re Buying
With 366 active zip-wide listings and prices ranging from $299,900 to $2,000,000, there is real room to shop, but the “most competitive” label means well-priced homes in the middle of that range are still drawing multiple offers within days, not weeks.
Is Tewksbury a buyer’s or seller’s market right now? By Redfin’s measure it leans toward sellers: homes average five offers and often close above list price. But a five-figure gap between two of Redfin’s own recent readings ($653K to $705,578) shows that “seller’s market” here means something looser than in a high-volume metro.
What Drives Price Differences Within Tewksbury
Tewksbury runs one town-wide school district rather than several boundary-zoned ones: six public schools, 3,205 students, a 13-to-1 student-teacher ratio, and per-student spending of $32,820 against a state median of $24,602. That matters for pricing because in towns split into multiple elementary zones, buyers often pay a premium for one boundary over another. Tewksbury doesn’t have that split, so the usual “which side of the line” price gap other Massachusetts suburbs show doesn’t really apply here.
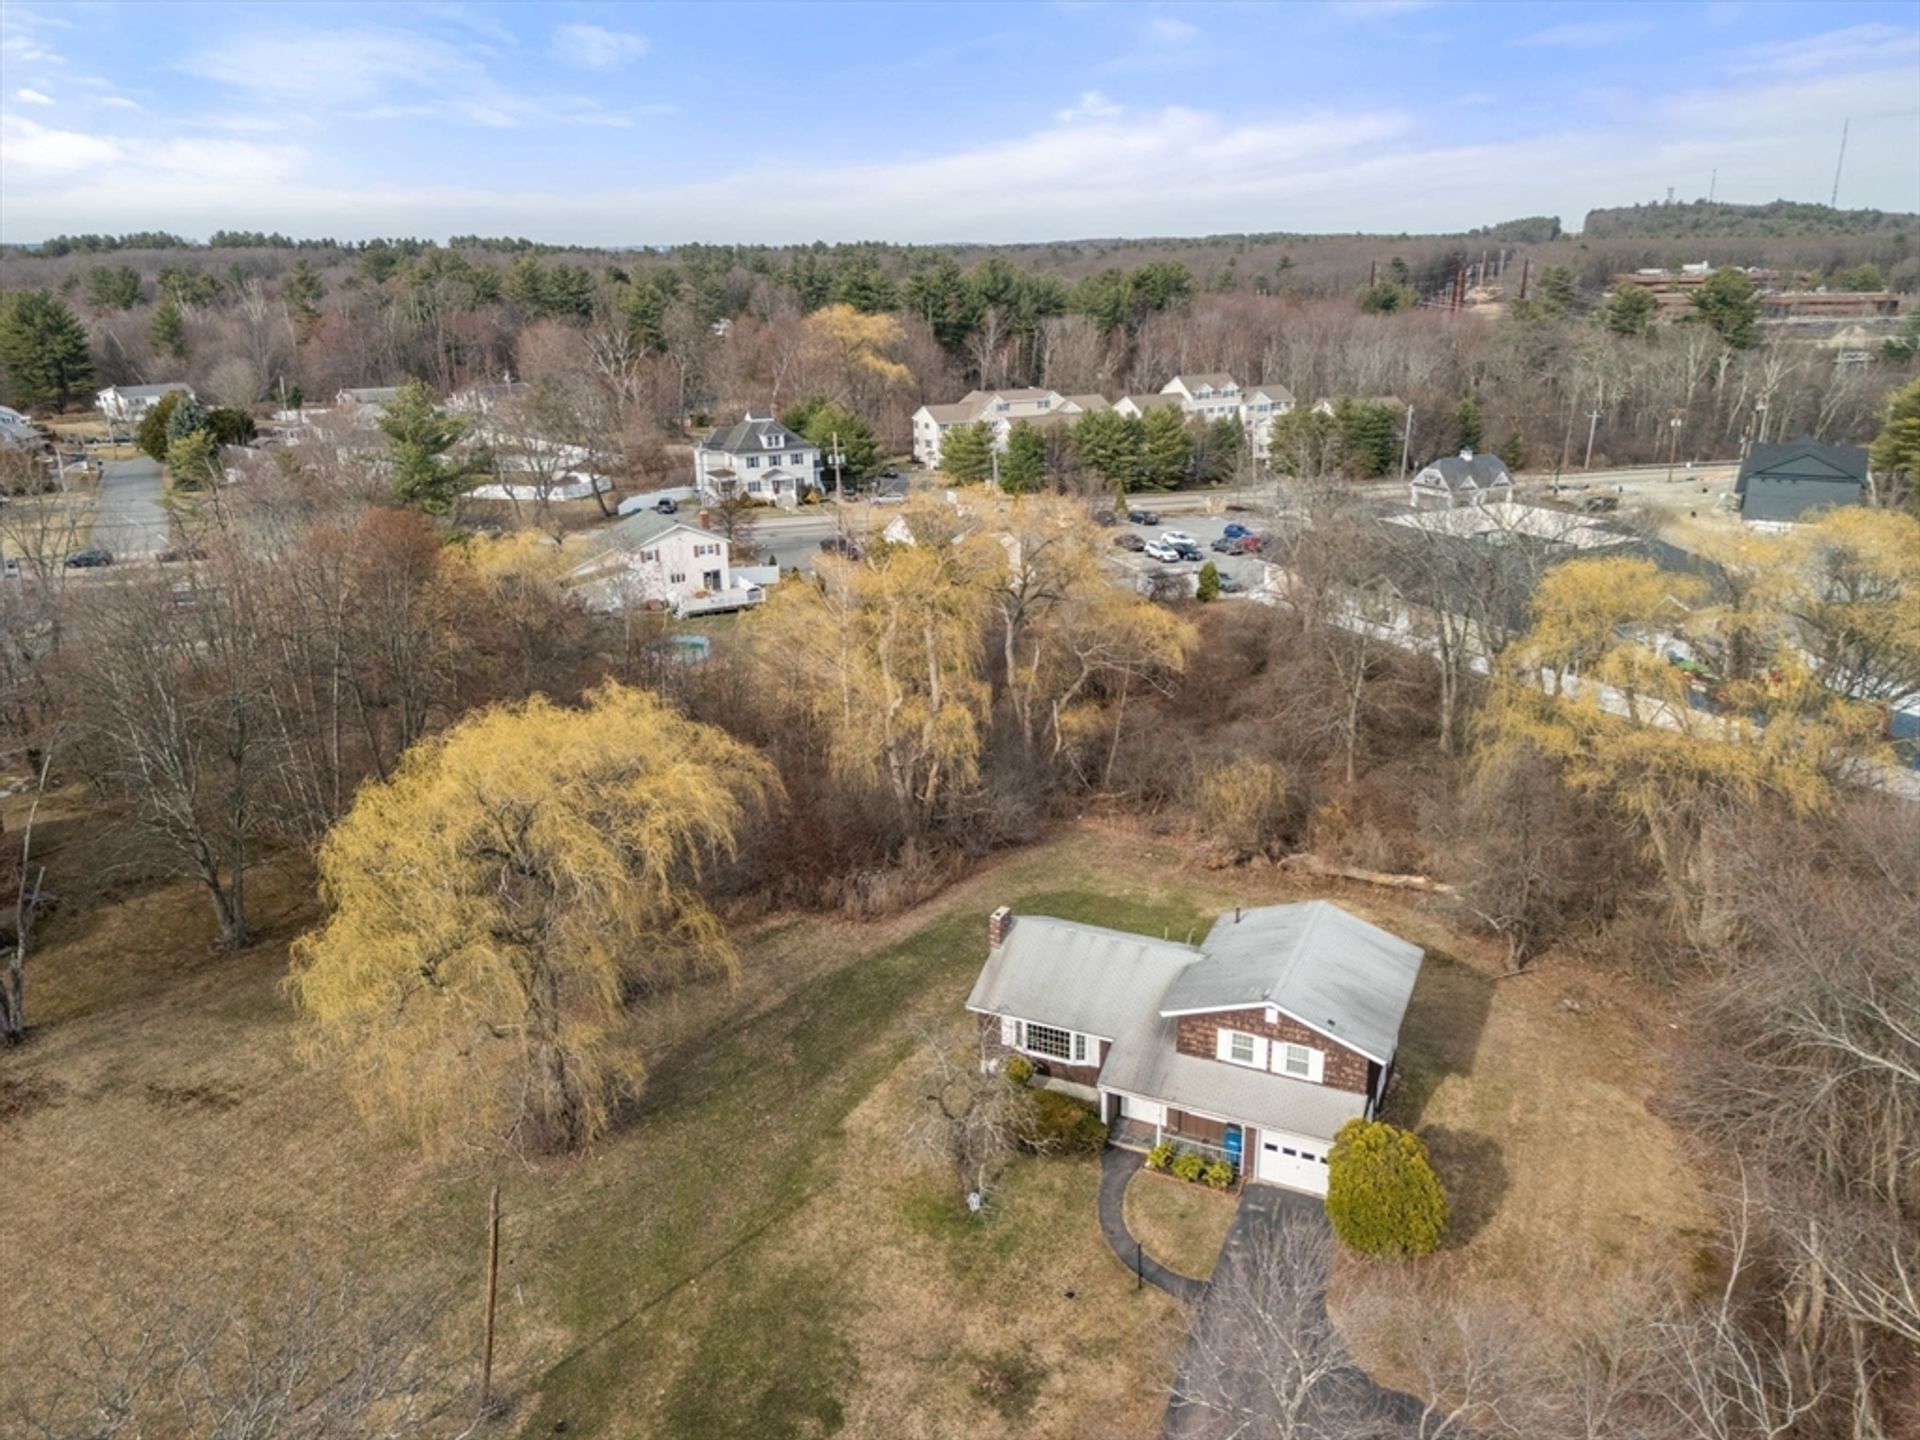
What does move price within the town is lot size and location. The $299,900-to-$2,000,000 spread across 01876 is wide for a town this size, and much of that spread traces to acreage rather than square footage. A listing at 32 Ward Street in north Tewksbury, marketed as “Green Hollow Orchard,” illustrates the pattern: a family held the 1,248-square-foot home for 54 years on a half-acre corner lot, with five separate outbuildings, two koi ponds, and blueprints already approved for expansion. None of that value shows up in a per-square-foot calculation, and it’s the kind of lot a north Tewksbury buyer competing on livable space alone would miss entirely. Confirm current status before relying on any single listing as a comp; a property’s availability shifts week to week same as any other.
What adds the most value to a home in Tewksbury? Lot size and buildable or expansion potential move price more than school assignment does, since the whole town shares one district. A larger corner lot with outbuildings or approved expansion plans, like the Ward Street property, can carry value a straight price-per-square-foot comparison won’t capture.
Who’s Moving In and Out of Tewksbury

Buyers searching from the New York metro area look at Tewksbury listings more than buyers from any other metro, followed by Hartford and Springfield. Among current Tewksbury owners searching elsewhere, Portland is the top destination, followed by Lebanon and Miami. This reflects Redfin.com search behavior among users who viewed at least ten homes in a three-month window, not completed moves.
The Distressed-Inventory Picture
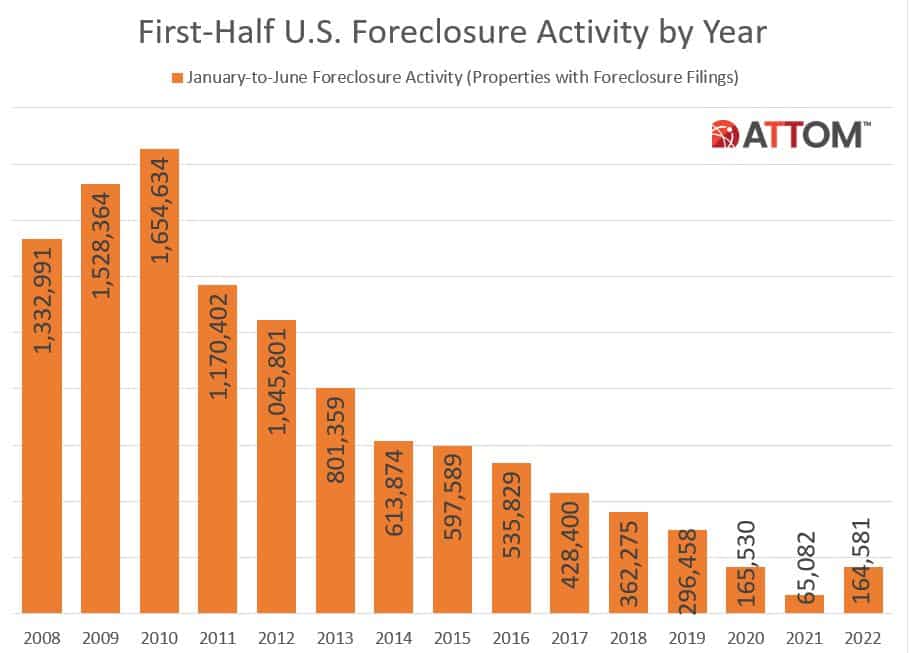
RealtyTrac’s 01876 data shows 16 properties in foreclosure, none bank-owned, and 5 headed to auction, against 366 total active listings and 318 sales in the trailing 12 months.
Treat these exact counts as directional, not precise. A companion RealtyTrac page for the same zip reports 11 pre-foreclosures using template language that includes the phrase “1 cities within 01876,” an artifact of automated data generation rather than a human-verified figure. For a purchase decision involving a specific distressed property, confirm status directly with the Middlesex North Registry of Deeds rather than relying on an aggregator’s count.
Even taking the higher published figure at face value, 16 foreclosures against 366 active listings is a small single-digit share, consistent with a market under pressure only at the margins rather than broad distress.
Are there a lot of foreclosures in Tewksbury? No. Even RealtyTrac’s count, 16 foreclosures against 366 active listings, is a small share of total inventory, and the underlying data has known reliability issues worth independently checking before acting on it.
If You’re Buying, What to Check Before You Offer
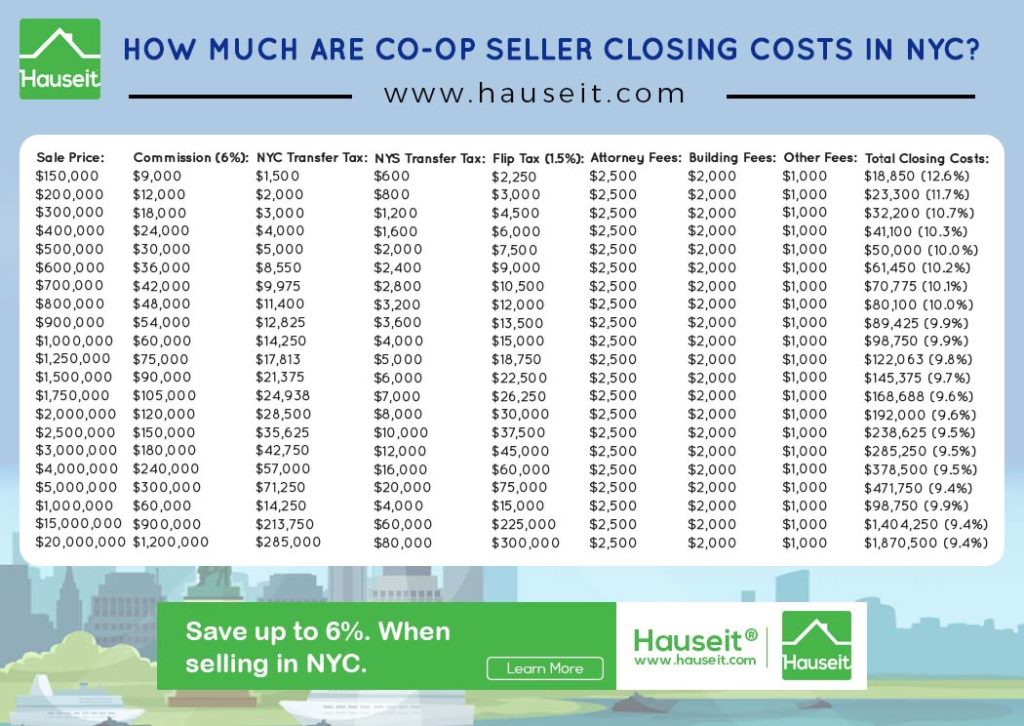
On a median $705,578 sale, Massachusetts’ deed excise tax runs $4.56 per $1,000 of price, about $3,200, paid by custom by the seller but negotiable in the purchase and sale agreement. Combined with a typical 5% commission (about $35,200) and roughly $1,500 in attorney and recording fees, total seller-side costs land near $40,000, or about 5.7% of the sale price, before any mortgage payoff.
| Cost item | Approx. amount on $705,578 sale | Who typically pays | Source |
|---|---|---|---|
| Agent commission (~5%) | ~$35,200 | Seller | BMN Boston |
| MA deed excise tax ($4.56/$1,000) | ~$3,200 | Seller by custom | Middlesex Registry of Deeds |
| Attorney/recording/misc. | ~$1,500 | Seller | BMN Boston |
| Net proceeds before mortgage payoff | ~$665,000 | Seller | BMN Boston |
For buyers, the excise tax is fixed and flat statewide with no tiered “mansion tax,” so it scales predictably with price, but who actually pays it is a negotiating point worth raising early rather than assuming.
A Word on Price Forecasts

WalletInvestor’s algorithmic model puts Tewksbury’s current median at $679,186 (June 13, 2026) and projects $780,435 by 2031 and $856,212 by 2035. These are automated projections without a published verification methodology behind the multi-year figures, and they shouldn’t substitute for a current comparative market analysis from a local agent working from actual pending and closed sales.
Timing: Rates, Inventory, and the Buy-or-Sell Tradeoff

| Date | 30-yr fixed rate | Change |
|---|---|---|
| July 9, 2026 | 6.49% | Up from 6.43% the prior week |
| July 2, 2026 | 6.43% | Seven-week low at the time |
| July 10, 2025 (year earlier) | 6.72% | – |
Source: Freddie Mac Primary Mortgage Market Survey.
A buyer today borrows at roughly 23 basis points below where rates sat a year ago, against 366 active zip-wide listings to choose from. A seller today is looking at Redfin’s most recent read showing an 11.1% year-over-year gain and sales still closing inside three weeks. Neither condition cancels the other out. A seller waiting for a still-higher print risks a rate move eating into a buyer’s budget before that print arrives. A buyer waiting for a further rate cut risks the specific listing they want being gone by the time it comes.
Comments