
Current Market Snapshot: Price and Pace
The two figures above aren’t a contradiction so much as a demonstration of how thin this market is. Sea Girt sees roughly a dozen to two dozen closed sales a year, and every data provider samples a slightly different window and a slightly different mix of homes within it. Both trackers agree on direction: prices are rising and homes are moving quickly. Neither should be read as a precise month-over-month percentage.
| Metric | Redfin (all-home-types, May 2026) | Movoto (closed sales, March 2026) |
|---|---|---|
| Median sale price | $3,298,026 | $2,072,500 |
| Year-over-year change | +21.7% | not separately reported |
| Recorded sales in period | not separately reported | 17, up from 10 a year earlier |
| Median days on market | 27 days (competitive-market average) | 38 days, down from 68 a year earlier |
Both trackers agree Sea Girt is a fast-moving, high-price market with days on market improving. Treat the specific dollar median as a range, not a point figure, until you have the actual comparable sale for the property you’re evaluating.
Is Sea Girt’s rising median price a reliable trend or a small-sample swing?Both, partially. Multiple independent sources agree prices are rising and homes are selling fast. No single month’s percentage change should be treated as precise, given closing counts in the dozens per year.
How Sea Girt Compares to Spring Lake, Manasquan, and Mantoloking
Every competitor page mentions these three towns as links. None puts them in one table. Here they are, each figure pulled from its town’s own most recent complete Redfin reporting window, which is the reason the periods below don’t line up: in towns this thinly traded, “most recent” means something different for each one.
| Town | Median sale price | Period | YoY | $/sqft | Median DOM |
|---|---|---|---|---|---|
| Sea Girt | $2,072,500 | Mar 2026 | not reported | not reported | 38 days |
| Spring Lake | $1.7M | Jun 2025 | -39.8% | not reported | not reported |
| Manasquan | $1.3M | Sep 2025 | -5.4% | $598 | 48 days |
| Mantoloking | $7.0M | 3 mo. ending Apr 2026 | +129.6% | $2,590 | not reported |
Even with mismatched windows, the ranking holds at every snapshot checked: Manasquan is the value entry point into the same school-district trio, Spring Lake sits in the middle, Sea Girt runs above both on a typical closing, and Mantoloking, driven almost entirely by oceanfront lots, sits in a different price tier altogether. Data source: Redfin Spring Lake, Redfin Manasquan, Redfin Mantoloking.
Is Sea Girt priced meaningfully above Spring Lake and Manasquan right now?Above Manasquan, yes, by a wide margin. Against Spring Lake the gap is closer and shifts with whichever month each town’s small sample happens to reflect.
Competitiveness: Sale-to-List Ratio and Days on Market
A sale-to-list ratio tells a buyer what to expect when writing an offer. Sea Girt splits clearly into two tiers.
| Segment | Sale-to-list ratio | Time to pending |
|---|---|---|
| Average Sea Girt sale | about 1% under list (≈99%) | 27 days |
| Hot Sea Girt homes | about 2% over list (≈102%) | 15 days |
| New Jersey statewide, May 2026 | 101.2% | 42 days |
Sea Girt’s average listing prices closer to ask than the state does, while its hot tier prices above ask and moves in barely half the state’s typical time. A well-positioned listing in Sea Girt behaves like a statewide “hot home” as its baseline case, not its exception.
Climate and Insurance Exposure

24% of Sea Girt properties, 155 of them, face severe flood risk over the next 30 years, and flood risk here is increasing faster than the national average, per Redfin’s First Street-sourced climate data. Every property in the borough carries severe wind-event exposure; a storm with today’s 1-in-3,000-year likelihood would currently produce gusts up to 125 mph, rising to roughly 146 mph on the same likelihood basis 30 years out.
None of the platforms that publish this risk data connect it to an actual premium. The most recent published New Jersey breakdown by FEMA flood zone, from 2018 NJ Department of Banking and Insurance-era data compiled by the Rutgers Climate Change Resource Center, is the clearest public source available:
| FEMA zone | Description | Avg. annual NJ premium |
|---|---|---|
| V zone | Coastal high-hazard, wave action | $4,738 |
| A zone | High-risk, no wave action | $1,272 |
| Preferred Risk Policy | Outside the mapped high-risk area | $410 (median) |
A Sea Girt buyer near the ocean should budget toward the V-zone figure, not the state’s blended average; a buyer several blocks inland, outside the mapped hazard area, may qualify for the much cheaper preferred-risk tier. Confirm the parcel’s actual zone before assuming either number applies.
Does Sea Girt’s flood risk change what I’ll pay for insurance?Yes, substantially. A V-zone property has historically averaged roughly 11 times the premium of a preferred-risk property outside the mapped hazard area, per the 2018 NJ breakdown above.
Zoning and Redevelopment Limits
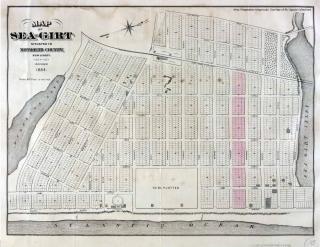
Sea Girt’s code, on file with the Borough and mirrored at eCode360, organizes the town into four numbered residential Districts plus a commercial district carrying an AH-3 affordable-housing overlay, not a single “E-1” designation some guides assume. Lot coverage, setback, and minimum lot-area rules differ by District, so a rebuild plan needs the specific numbers for that parcel’s District from the Borough’s Zoning and Code Enforcement office directly, not a borough-wide figure.
New Construction and the Teardown Economics Behind $/sqft
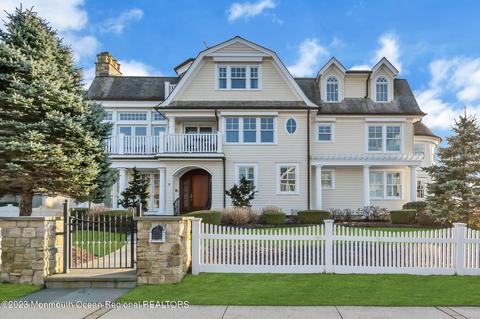
A 2026 brokerage market analysis from Prodigy Real Estate, not a government filing, describes Sea Girt’s dominant transaction type as land-value acquisition: older homes bought primarily for the lot, typically in the $2 million to $3.5 million range, demolished, and replaced with 4,000 to 6,000-plus square-foot new construction at $400 to $650 per square foot, reaching end values of $4 million to $7 million-plus depending on ocean proximity. The same report ties this to Sea Girt’s built-out status: the borough’s Realistic Development Potential under its fourth-round affordable-housing planning is documented as zero additional units, per the NJ Department of Community Affairs framework that governs how those figures are calculated statewide; the report’s specific claim of a 73-unit fourth-round obligation for Sea Girt itself comes from that brokerage analysis and was not independently confirmed against the Borough’s own adopted Housing Element in this review.
For a sense of where that ceiling can go next door: as of Redfin’s June 21, 2026 update, 13 recently sold Mantoloking listings carried a median list price of $9.25 million.
Can I tear down and rebuild on a standard Sea Girt lot?Generally yes in principle, since almost all Sea Girt activity now runs through redevelopment rather than new land. The buildable envelope still depends on the parcel’s zoning District and requires Borough sign-off.
Buying, Selling, and Renting: Which Approach Fits Which Buyer
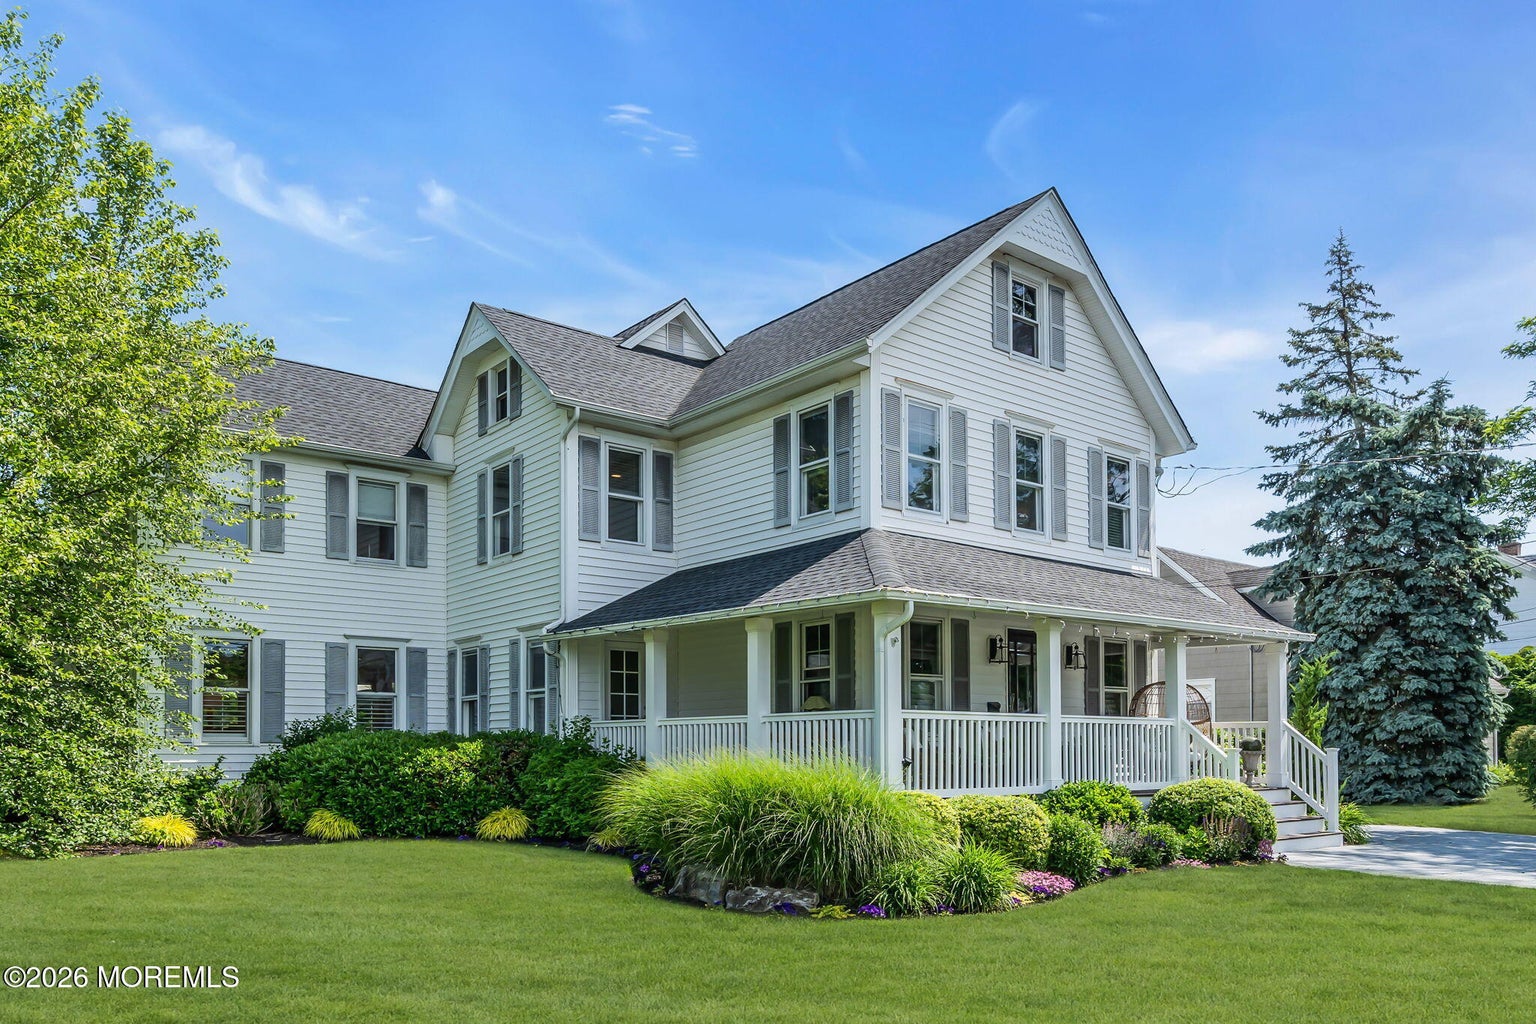
- Owner-occupant buyer: expect to compete in the 15-to-27-day window above, and price an offer against the hot-homes tier if the listing is well-positioned, not the average tier.
- Seasonal-rental investor: Sea Girt has been tightening rental-certificate requirements and raising compliance standards, per the Prodigy report, which raises operating friction for short-term rental income compared with looser shore markets. No verified summer-versus-winter rate data for Sea Girt specifically was found in this review; treat any such figures you’re given elsewhere with the same skepticism applied to the price data above.
- Seller timing: listing into the hot-homes tier (15 days, ~2% over ask) versus the average tier (27 days, ~1% under ask) is the practical difference between waiting one season and not.
None of this changes the underlying scarcity: Sea Girt’s housing stock effectively cannot grow.
Is seasonal-rental investing realistic in Sea Girt?Possible, but increasingly regulated. The borough has been raising short-term rental certificate requirements, which adds compliance overhead beyond what a simple rent-versus-mortgage calculation would show.
Foreclosure and Distressed Inventory: What You Can Verify

Automated ZIP-level stat pages for 08750 circulate foreclosure and price-range figures that don’t hold up under inspection, including at least one that shows a mathematically impossible percentage change; none of those figures are reproduced here. For real, current activity, Monmouth County Sheriff’s sales are held every other Monday and listed directly by the Monmouth County Sheriff’s Office. No verified Sea Girt-specific count was confirmed in this review; check that page directly rather than relying on a third-party aggregator’s summary number.
Comments