
Is Rocky Mount a Buyer’s or Seller’s Market Right Now
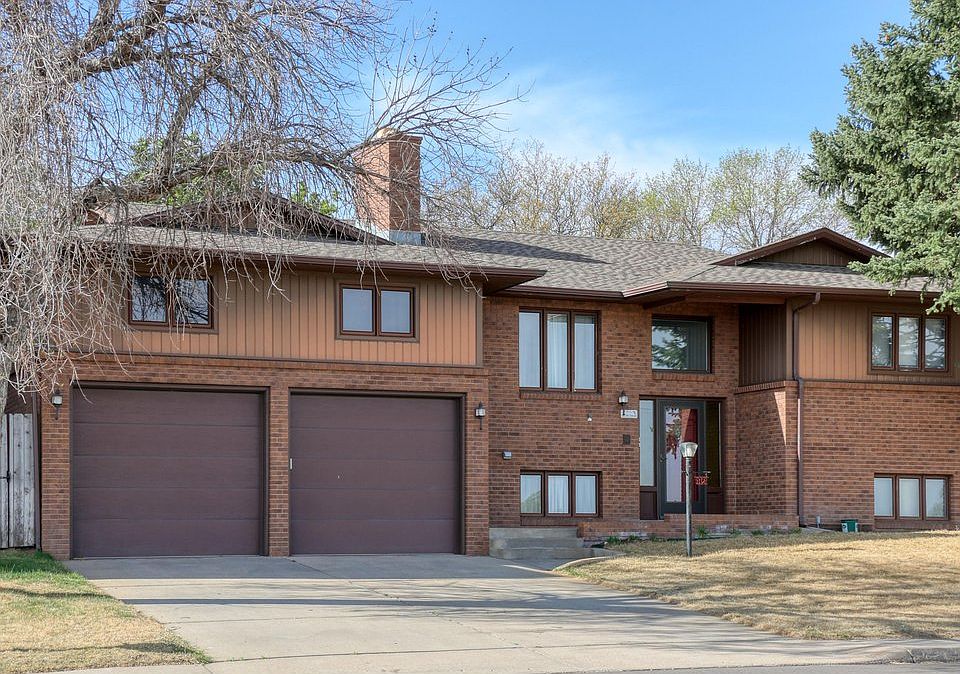
Redfin’s calculation of home data from MLS and public records puts the three-month median sale price at $205,000 through May 2026, up 9.0% from a year earlier, with the median price per square foot at $136. That pace reads like a tightening market. The supply side complicates that read: real estate directory Clever counted 773 active listings in a recent month and 6.9 months of supply, a level Clever itself classifies as a buyer’s market, while a separate Bankrate snapshot from January 2025 showed 4.7 months of supply. Dividing Redfin’s 133 homes sold in May 2026 by the roughly 865 properties active that month, produces a sales-to-listings ratio of about 0.15. That sits inside the 0.12 to 0.2 balanced band, nearer the buyer half than the seller half, even while price is climbing 9% a year. The two readings are not contradictory: price momentum can run ahead of the sales-to-listings math when a market has a run of higher-priced sales, and Rocky Mount’s price tiers run from a $47,528 bottom tier to a $528,507 luxury tier, wide enough for tier mix alone to move the median.
Does the buyer’s/seller’s ratio apply the same way to investment condos as single-family homes? No. The ratio above is calculated across all residential sales combined. Condo inventory is a small share of Rocky Mount’s market, so a handful of condo sales can swing a segment-level ratio far more than they move the citywide figure. Investors comparing condo and single-family conditions should ask for a segment-specific count rather than applying the citywide 0.15 to both.
Price and Days on Market by Zip Code
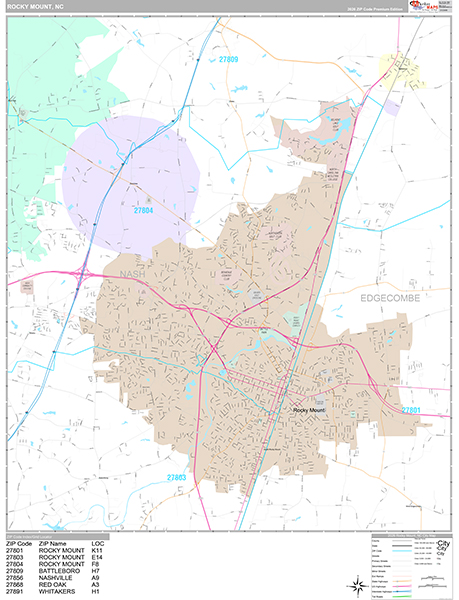
The city’s zip codes span a $255,950 price gap, from a $163,950 median active listing price in 27801 to $419,900 in 27809.
| Zip | Median active listing price | Context |
|---|---|---|
| 27801 | $163,950 | Downtown and east-side zip, the city’s oldest housing stock |
| 27803 | $244,000 | Mid-range pricing, close to the citywide median |
| 27804 | $269,900 | Largest zip by inventory, 521 active listings per Realtytrac |
| 27856 | $412,500 | Second-highest priced zip, on the Nash County side |
| 27809 | $419,900 | Highest-priced zip in the city |
Source for zip prices: Redfin’s zip-level listing data. A buyer using only the $205,000 citywide median to budget for 27809 would be off by more than $214,000, roughly the price of a second home in 27801.
Why does the citywide median hide zip-level differences? Because it blends the oldest, least-expensive stock in 27801 with newer or larger-lot listings in 27809 and 27856 into a single number. The zips at either end differ by more than $255,000, so the citywide figure describes the middle of the distribution, not any single zip’s typical listing.
What’s Driving Current Inventory
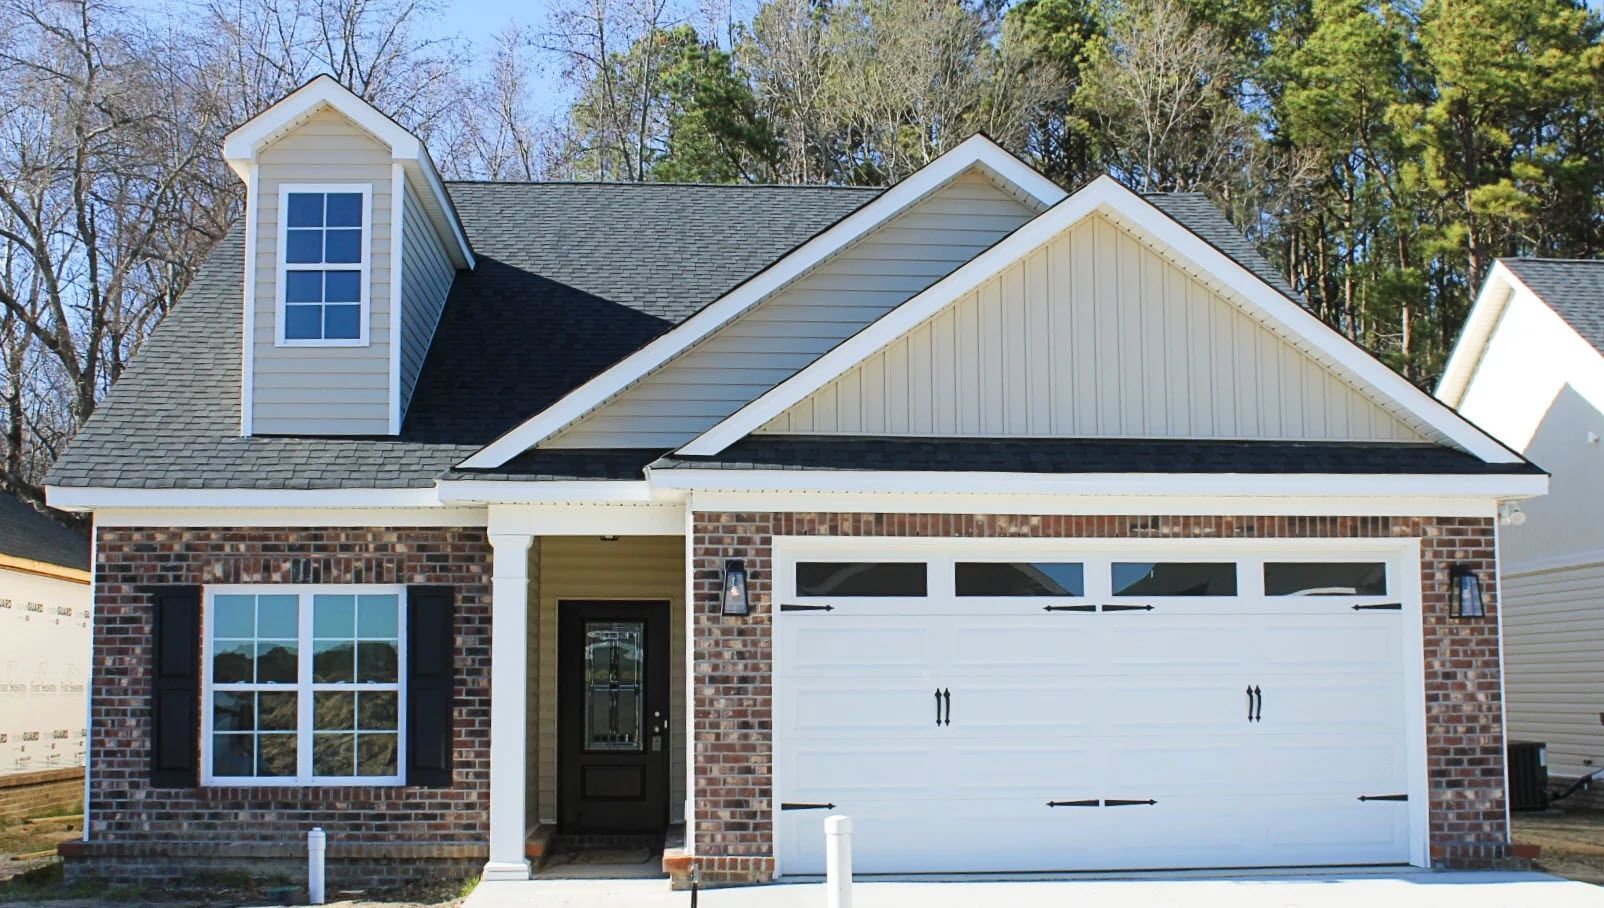
New construction makes up a modest, verifiable share of what’s for sale: Homes.com lists 81 new-construction homes against roughly 865 total active listings citywide, about 9%, a listing-count proxy rather than a permit-based figure. Downtown’s most notable recent addition was Five Point Crossing, an affordable housing development that opened in March 2024, rather than market-rate new construction.
Climate and Insurance Risk in Rocky Mount

Sixteen percent of Rocky Mount properties face severe flood risk over the next 30 years, and 77% face severe wind risk, according to First Street data published through Redfin.
| Risk type | % of properties affected (30-yr) | Practical implication |
|---|---|---|
| Flood | 16% (2,587 properties) | NC’s average NFIP premium is $780 a year; U.S. News’s analysis of FEMA data puts high-risk and coastal high-risk NFIP premiums above $1,600 a year |
| Wildfire | 4% | Minimal effect on most standard homeowner underwriting |
| Severe wind | 77% | NC homeowner policies commonly carry a separate wind or hurricane deductible |
| Severe heat | 99% | Raises cooling costs and insulation priorities; not typically priced into insurance premiums |
The flood figure is the one with a direct line to a dollar amount: a property in a mapped high-risk zone can expect an NFIP premium two to three times the state’s low-risk average.
How much do flood and wind risk add to insurance costs in Rocky Mount? Flood carries the clearest cost: NFIP premiums average $780 a year statewide in North Carolina, but FEMA-mapped high-risk properties average more than $1,600 a year. Wind doesn’t show up as a separate line in most NFIP data, but NC homeowner policies commonly carry a distinct wind or hurricane deductible, which matters given that 77% of Rocky Mount properties carry severe wind exposure.
For Investors: Rough Rental Yield in Rocky Mount
Long-term rental math: Rentometer’s current data puts average three-bedroom rent in Rocky Mount at $1,450 a month. Against Redfin’s $205,000 median sale price, that’s a gross annual yield of about 8.5%, before taxes, insurance, vacancy, or maintenance.
Short-term rental math looks different: Rabbu’s Airbnb-specific data, drawn from 48 active listings as of April 2026, shows an average home value of $294,504 for properties actually operating as short-term rentals and average annual revenue of $15,251, a gross yield of about 5.2%, well below the long-term figure because short-term operators tend to buy in higher-priced, higher-amenity segments rather than at the citywide median. Buying does carry a real income cost relative to renting: Redfin’s income-premium calculation, reported by Stacker, put the income needed to afford Rocky Mount’s typical home at 50% above the income needed to afford its typical apartment as of December 2025.
Is a 6 to 8% gross yield realistic in Rocky Mount right now? Yes, for long-term rentals bought near the citywide median: the math above lands at roughly 8.5% gross on a $205,000 purchase against $1,450 monthly rent. Short-term yields run lower in practice, closer to 5.2% gross, because Airbnb-active properties in Rocky Mount average nearly $90,000 above the citywide median sale price.
How Rocky Mount Compares to Wilson, NC
| Metric | Rocky Mount | Wilson, NC |
|---|---|---|
| Median sale price | $205,000 (3-mo, May 2026) | $265,000 (June 2025) |
| YoY price change | +9.0% | -3.3% |
| Median days on market | 57 | 44 |
| Flood risk (30-yr) | 16% | 13% |
| Severe wind risk (30-yr) | 77% | 68% |
Source: Redfin’s Wilson housing market data. Wilson sits roughly 15 miles east and carries a higher median price with a shorter time on market, but its most recent Redfin snapshot shows prices falling year over year while Rocky Mount’s are rising. For context, North Carolina’s statewide median was $378,655 in May 2026, up 1.0% year over year.
One Rocky Mount listing on Redfin markets its location as minutes from Wilson and Sharpsburg.
Common Mistakes When Reading Rocky Mount Market Data

- Mixing sold-price figures with list-price figures across sources. Redfin, Bankrate, and Homes.com report different price bases in the same general period; comparing them directly overstates or understates real movement.
- Comparing days-on-market figures across sources as if they measure the same thing. Redfin’s 57 days, Clever’s 82 days, and Homes.com’s 54 days come from different listing pools and calculation windows.
- Applying the 0.12 to 0.2 sales-to-listings rule to a segment, like condos, without recalculating it for that segment.
- Assuming a rising median price always means tightening supply. Rocky Mount’s price is up 9.0% year over year even as several sources put months of supply above 4.7, closer to balanced than tight.
Comments