
The Four-Way Split: Hudson Heights, the Core, Fort George and the South End
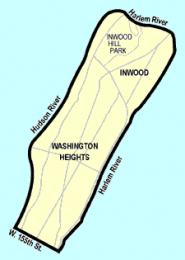
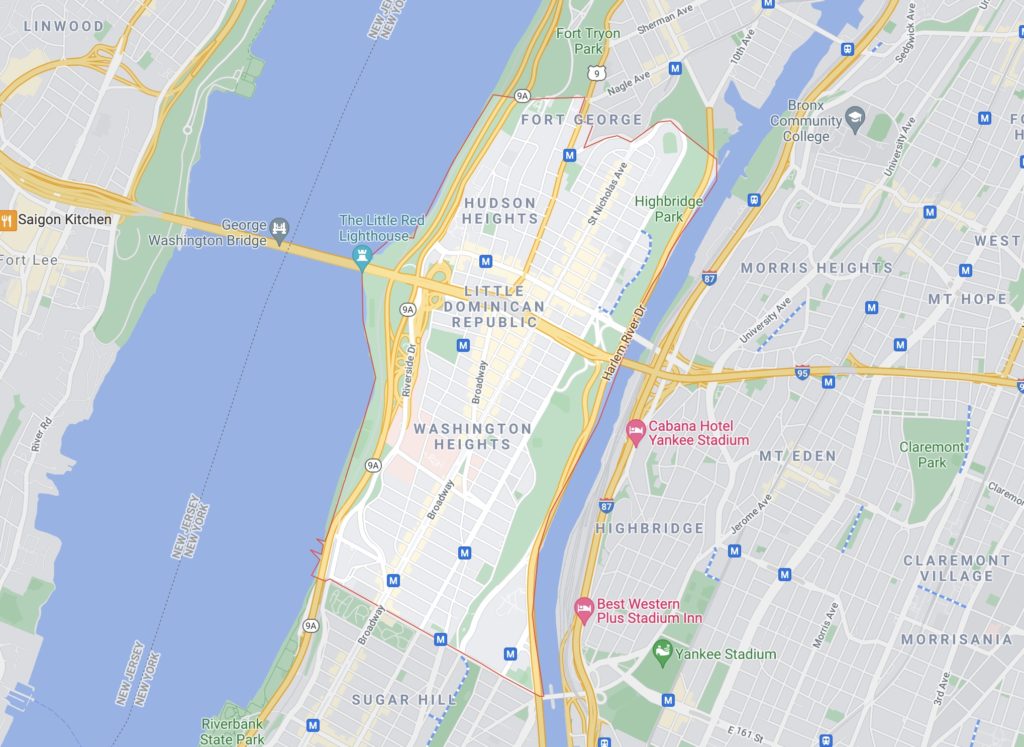
Washington Heights breaks into at least four distinct pockets, and which one a listing sits in changes the price and the demographics more than any neighborhood-wide average shows.
| Sub-area | Boundary streets | Housing stock | Price signal | Demographic note |
|---|---|---|---|---|
| Hudson Heights | Hudson River to Broadway, roughly W. 173rd–181st St, up to Fort Tryon Park | Pre-war co-ops, Art Deco and Tudor Revival buildings from the 1920s to 1940s | Highest in the neighborhood; one-bedrooms commonly exceed $3,000 | Homeownership near 25% |
| Core / Broadway corridor | Broadway and St. Nicholas Ave, W. 155th–181st St | Mixed pre-war rentals above ground-floor retail | Near the neighborhood average | Neighborhood’s commercial spine |
| Fort George | East of Broadway/Amsterdam Ave, W. 181st St to Dyckman St | Older walk-ups and mid-rise rentals | Below the neighborhood average | Homeownership near 5% |
| South Washington Heights | W. 155th–173rd St | Dense pre-war rentals closest to Harlem | Below the neighborhood average | Highest population density band |
The homeownership gap, about 25% west of Broadway against roughly 5% east of it per a census-tract analysis by journalist Inti Pacheco, lines up with the price divide almost block by block.
Is Washington Heights the same as Hudson Heights? No. Hudson Heights is the informal name for the blocks west of Broadway near Fort Tryon Park, roughly W. 173rd to 181st Street. It sits inside Washington Heights, not beside it, and carries higher co-op prices than the rest of the neighborhood.
What Washington Heights Costs Right Now
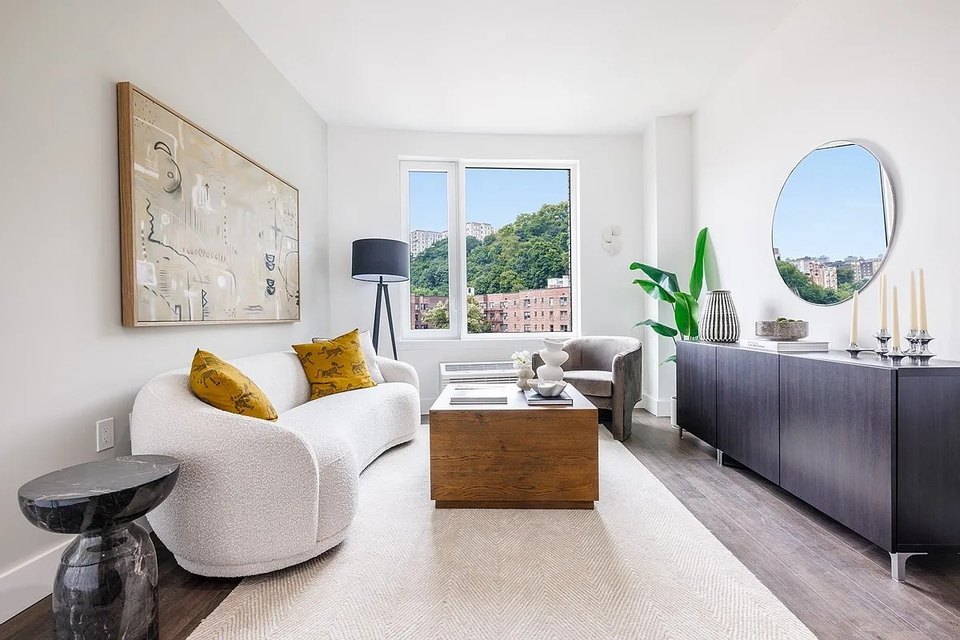
Two different rent figures circulate for this neighborhood, and they measure different things. Average asking rents tracked by RentCafe’s Yardi Matrix data, current as of March 2026, run from $2,100 for a studio to $4,133 for a three-bedroom, up 6.2% from a year earlier.
| Unit size | Average asking rent | Average unit size |
|---|---|---|
| Studio | $2,100 | 469 sq ft |
| One-bedroom | $2,493 | 766 sq ft |
| Two-bedroom | $3,246 | 1,002 sq ft |
| Three-bedroom | $4,133 | 1,143 sq ft |
Median home sale price is $448,000, tracked from live REBNY/RLS listing data; two-bedroom co-ops list at a median asking rent of $3,204, per a Keller Williams NYC market report.
In the city’s oldest, most heavily rent-stabilized buildings, concentrated in part in Washington Heights/Inwood, the median collected rent was $1,395 a month in 2025, roughly what a household earning 40% of the area median income can afford, per a 2026 Furman Center data brief.
Why do rent numbers for Washington Heights vary so much online? They measure different pools. Listing sites average only apartments currently for rent, which skews toward market-rate turnover units. Census surveys average what every renter actually pays, including long-term rent-stabilized tenants. The true figure for any specific unit depends heavily on whether it’s regulated.
Getting Around
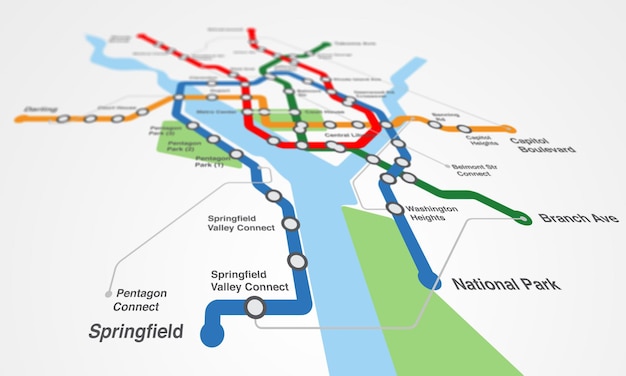
Three subway lines reach the neighborhood: the A, the C, and the 1, stopping at 168th, 175th, 181st and 190th Streets, per the MTA subway map. A reliable, sourced minute-by-minute commute-time table to Midtown or Downtown job hubs was not available in the materials reviewed for this page and is listed as an open research task below rather than estimated.
Is Washington Heights Safe
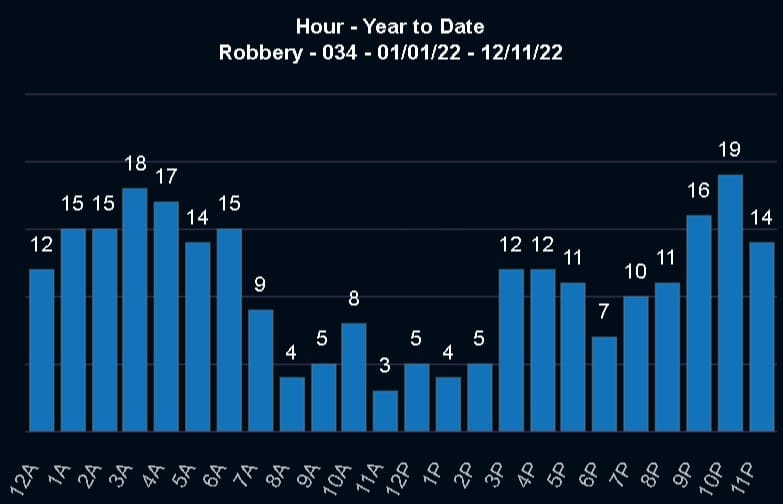
Long-term violent and property crime trends in the 33rd Precinct are mixed, not uniformly down: felony assault has been climbing for years and rose again this year, while robbery and auto theft have both fallen sharply.
| Crime category | 16-year change | YTD 2026 | YTD 2025 |
|---|---|---|---|
| Murder | -100% | 0 | 1 |
| Robbery | -45.9% | 53 | 55 |
| Grand larceny, auto | +13.8% | 33 | 58 |
| Burglary | +30.2% | 56 | 47 |
| Felony assault | +80.0% | 135 | 103 |
| All major felonies | +11.9% | 413 | 412 |
Data: NYPD 33rd Precinct CompStat, week of June 1–7, 2026.
Felony assault and burglary are the two categories moving the wrong way, up 80% and 30.2% over 16 years respectively, while robbery and auto theft have both fallen by more than 40% over the same span.
Is Washington Heights safe at night? Robbery and grand larceny auto have both fallen by more than 40% over 16 years in the 33rd Precinct, and murder was down to zero complaints in the most recent year-to-date period. Felony assault is the exception: it has nearly doubled over the same 16 years and rose again this year, so the honest answer depends on which crime category matters most to you.
Who Lives Here and How That’s Changing
The neighborhood’s income mix has shifted upward since 2000, even as it remains poorer than New York City as a whole. Population was an estimated 182,736 in 2024: 62.6% Hispanic, 22.2% White, 8.7% Black, 3.3% Asian, per the NYU Furman Center. Median household income was $68,550, about 18% below the citywide figure of $83,970, and the poverty rate was 19.2% against 18.0% citywide.
The clearest trajectory signal: in 2024, the largest single household-income bracket was $100,001–$250,000, holding 29.5% of households; in 2000, the largest bracket was $60,001–$100,000, holding 23.1%. That’s a real upward shift in the neighborhood’s income composition over roughly two decades, not just static census trivia.
Housing Reality Check: Rent Burden and a Tight Market
Nearly a third of renters are severely cost-burdened, and the rental market is tight enough that turnover is rare. Severely rent-burdened renters, spending over half their income on rent, reached 30.2% in 2024, and median gross rent grew 3.4 percentage points faster than median household income that year. Rental vacancy was 3.0% in 2024. Homeownership sits at 12.3%, against 32.7% citywide.
Is Washington Heights affordable compared to the rest of Manhattan? Relative to Manhattan overall, yes: it ranks 40th of the city’s 59 neighborhoods by rent, so most of the borough costs more. Relative to its own residents’ incomes, no: median household income is 18% below the citywide figure, and three in ten renters are severely cost-burdened.
The Commercial Corridor

Broadway and St. Nicholas Avenue carry the neighborhood’s retail. Of 449 storefronts surveyed along that corridor by the NYC Department of Small Business Services in its 2019 needs assessment, 35% were rated in poor condition, 56% average, and 9% good. Fort Tryon Park, home to the Cloisters, sits at the neighborhood’s northern edge.
Comments