
Market snapshot
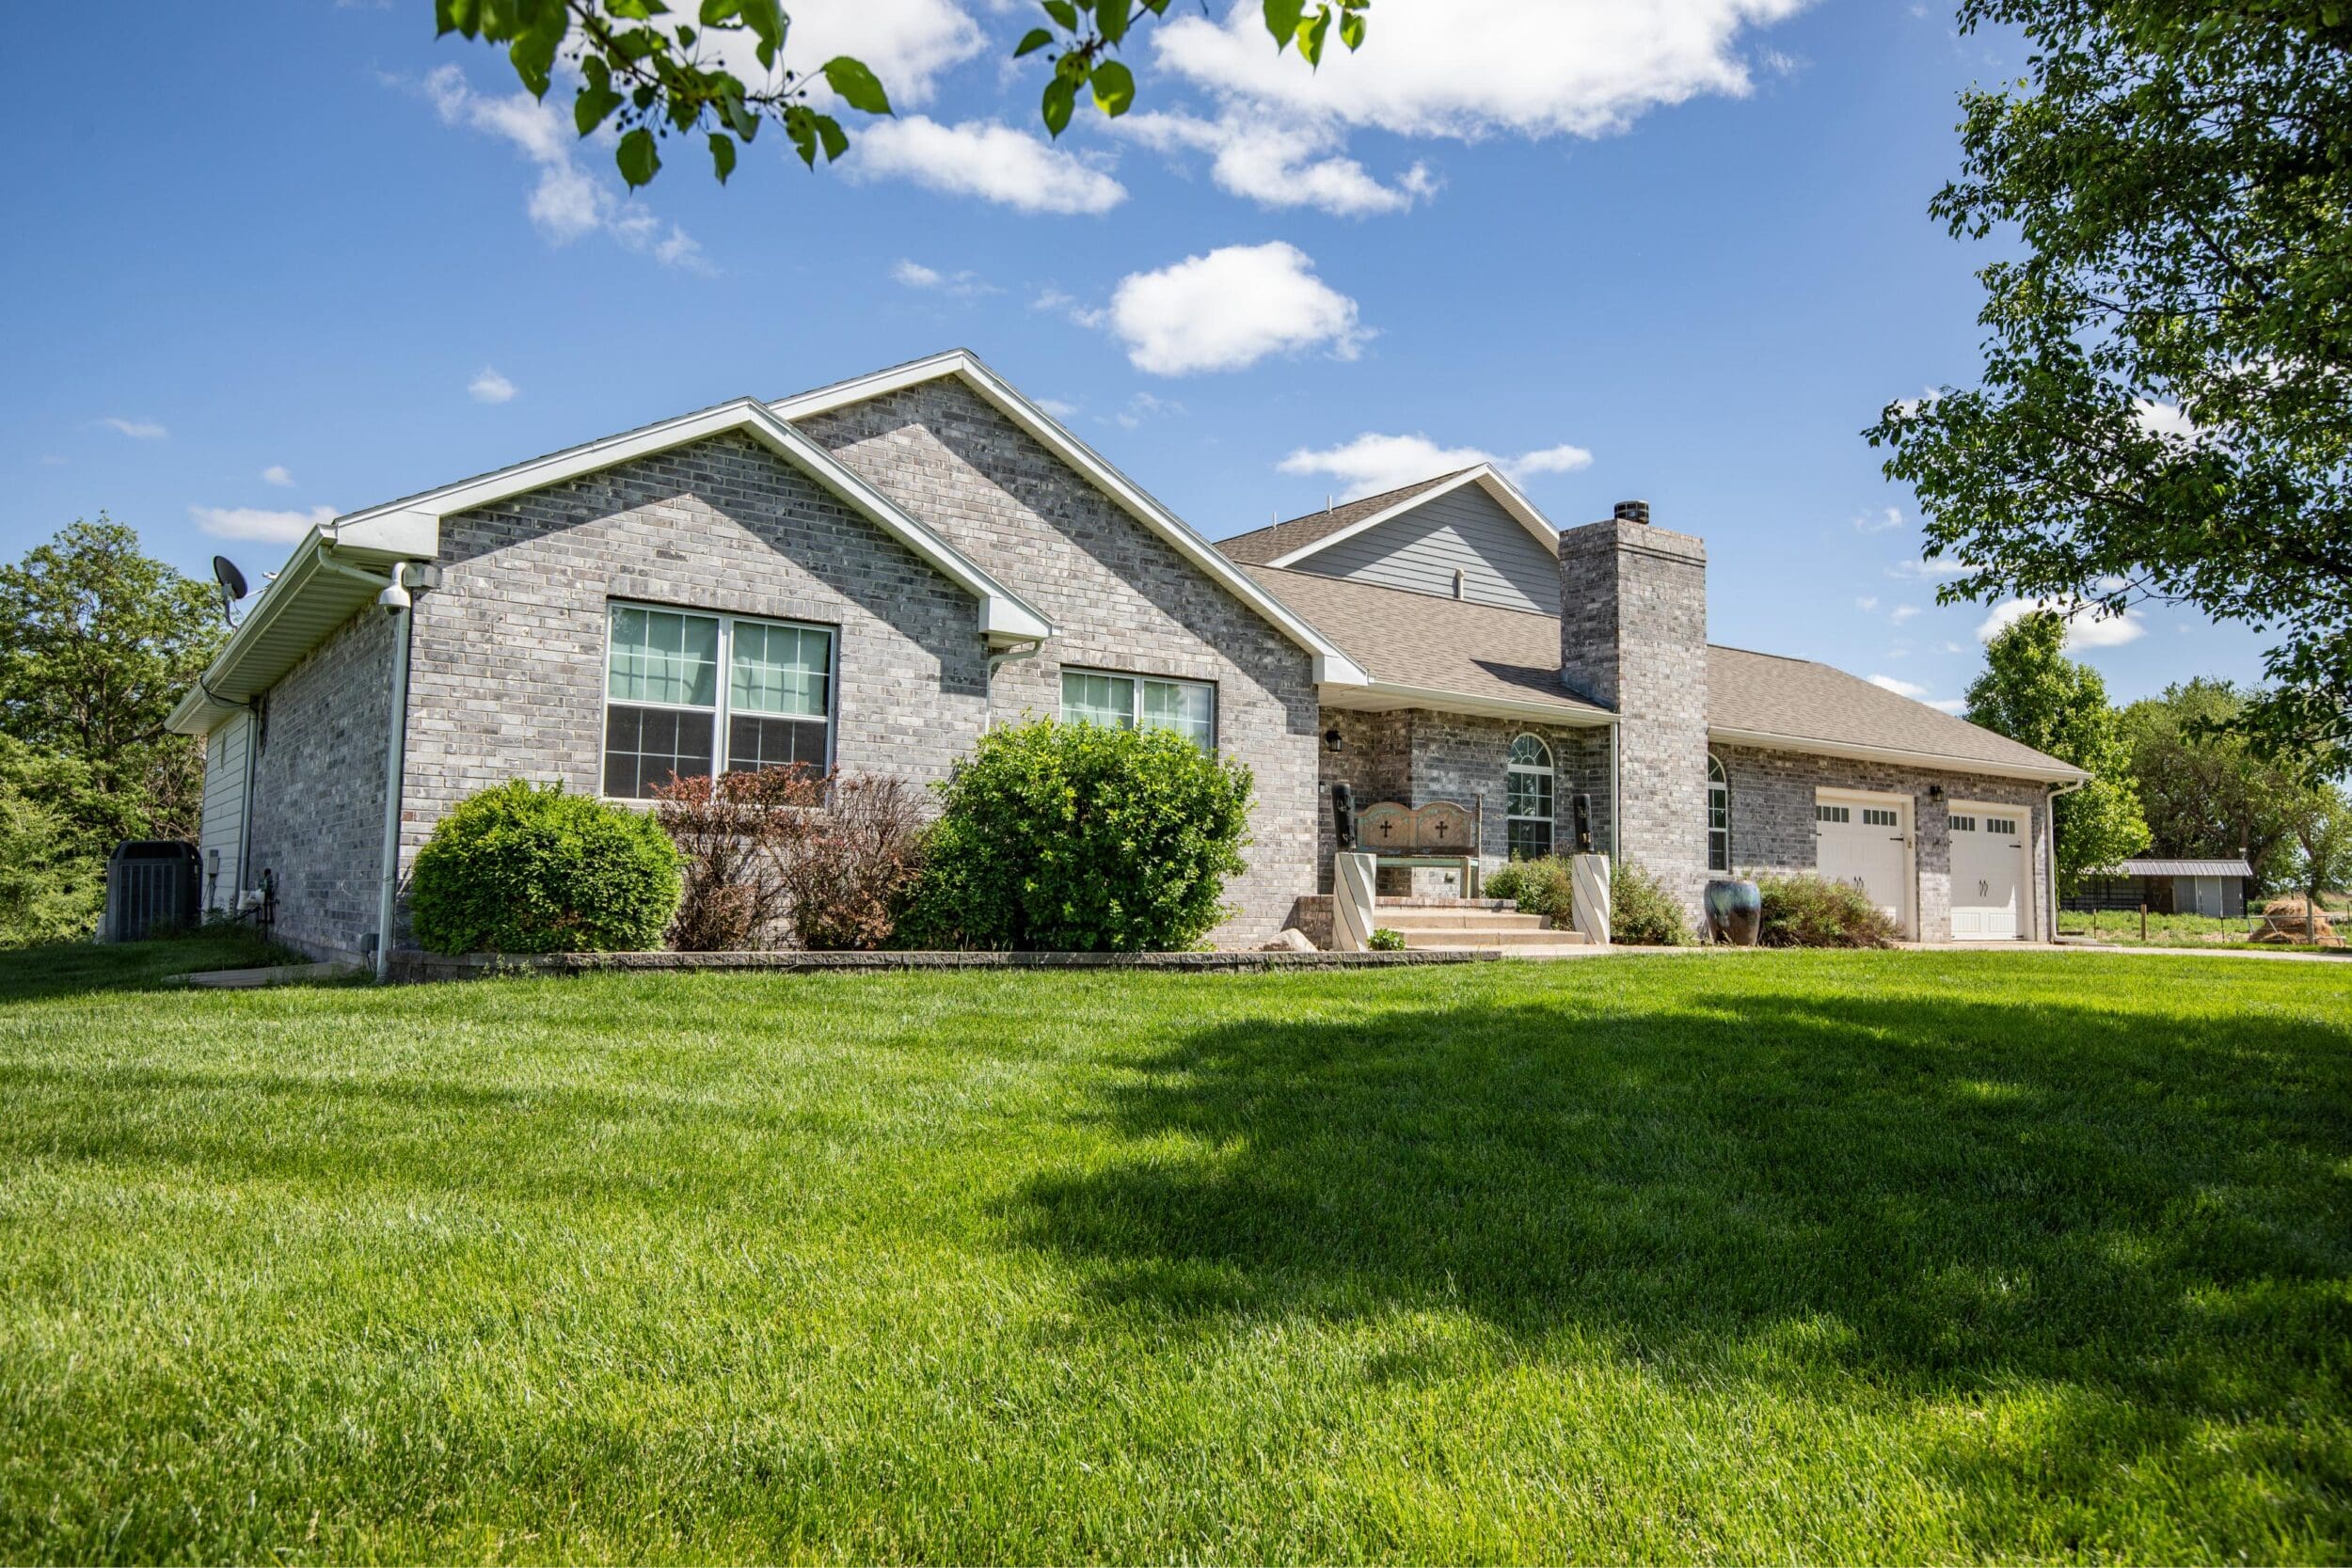
The price drop and the slower selling pace moved together: fewer homes changed hands (5 in November 2025 versus 9 a year earlier), and the ones that sold took over three times as long. That combination usually means sellers are pricing above what the current buyer pool will pay, not that overall demand collapsed.
| Metric | Current value | Trend / context |
|---|---|---|
| Median sale price, city of Great Bend | $220,000 (Nov 2025) | Down 7.9% year over year |
| Median days on market | 109 days (Nov 2025) | Up from 31 days a year earlier |
| Homes sold, most recent month | 5 | Down from 9 a year earlier |
| Active listings, zip 67530 | About 71 | Median asking price $192,000 |
| Median property value, ACS estimate | $126,400 (2024) | Up 7.85% from $117,200 in 2023 |
Figures come from Redfin’s Great Bend housing market data, Redfin’s zip 67530 listing count, and the Census ACS profile via Data USA. The MLS-measured sale price and the ACS-measured property value moved in opposite directions over roughly the same window, a reminder that a transaction-based median and an assessment-based estimate answer slightly different questions and will not always agree in a market this thin.
Is now a good time to buy in 67530? The MLS-reported median moved down 7.9% year over year while days on market roughly tripled, a combination that favors buyers on price but means a specific home’s condition and location matter more than the zip median right now.
Cost of ownership
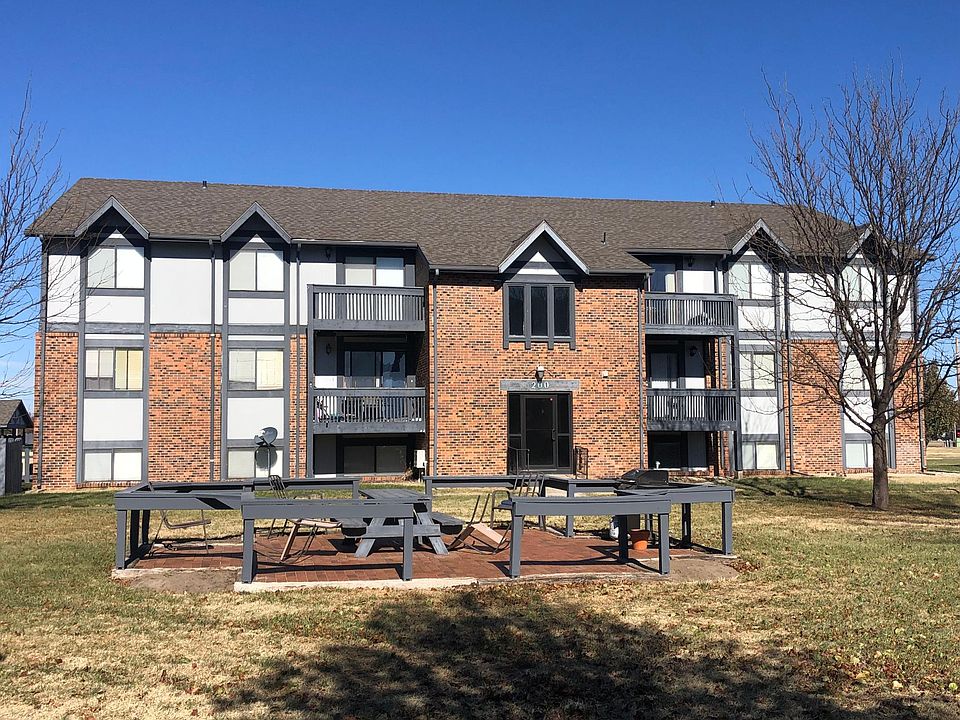
Property tax on a median mortgaged home runs about $2,552 a year, 1.7% of assessed value, against $2,276 for owners without a mortgage, according to 2024 figures compiled from Census records by City-Data. Median gross rent of $759 a month works out to $9,108 a year, about 16.8% of the zip’s $54,139 median household income reported by the Census-sourced Point2Homes profile, well under the 30%-of-income threshold HUD uses to flag housing-cost burden. That gap is one reason rental demand here reads as stable: a household at the median income has room before rent becomes a strain.
Is 67530 a good rental market? Median rent sits at about 17% of median household income against a federal 30% affordability benchmark, so at the median the numbers don’t show renters stretched, which supports steady occupancy more than it promises high yield.
Housing stock and what it means for financing

Great Bend’s 7,185 housing units skew heavily toward detached single-family homes (69.8%), with mobile homes making up 8.7% and attached units a small 3.3%. The median construction year is 1959, and 17.8% of homes were built before 1940, with another 8.5% completed by 1949, so about a quarter of the stock predates 1950.
Financing an older home in 67530
A 1959 median build year puts most of the local stock ahead of 1978, the cutoff year for the EPA and HUD’s federal lead-based paint disclosure rule, which requires sellers of pre-1978 housing to disclose known lead-paint hazards and give buyers a 10-day inspection opportunity before closing. Lenders and inspectors treat this cutoff as a practical marker for wiring and plumbing age too: knob-and-tube wiring and galvanized supply lines both show up more often in stock from this era, and either can complicate a conventional appraisal or an FHA underwriting decision if a home inspector flags them.

| Construction era | Share of housing stock | Financing note |
|---|---|---|
| Before 1940 | 17.8% | Pre-1978 lead-paint disclosure applies; inspect original wiring and plumbing |
| 1940–1949 | 8.5% | Same disclosure rule; more likely to have had at least one electrical upgrade |
| Median build year | 1959 | Sits inside the pre-1978 disclosure window |
| Detached single-family share | 69.8% | Mobile homes (8.7%) often need chattel or manufactured-home loan products instead of a standard mortgage |
Close to a quarter of the housing stock predates 1950, so budget for an inspection contingency and a lead-paint disclosure review before assuming a standard 30-year conventional timeline will close without extra steps.
How old are most homes in this zip code? The median home was built in 1959, and about a quarter of the stock dates to before 1950, old enough that the federal lead-paint disclosure rule applies to most purchases here.
Risk factors to ask about
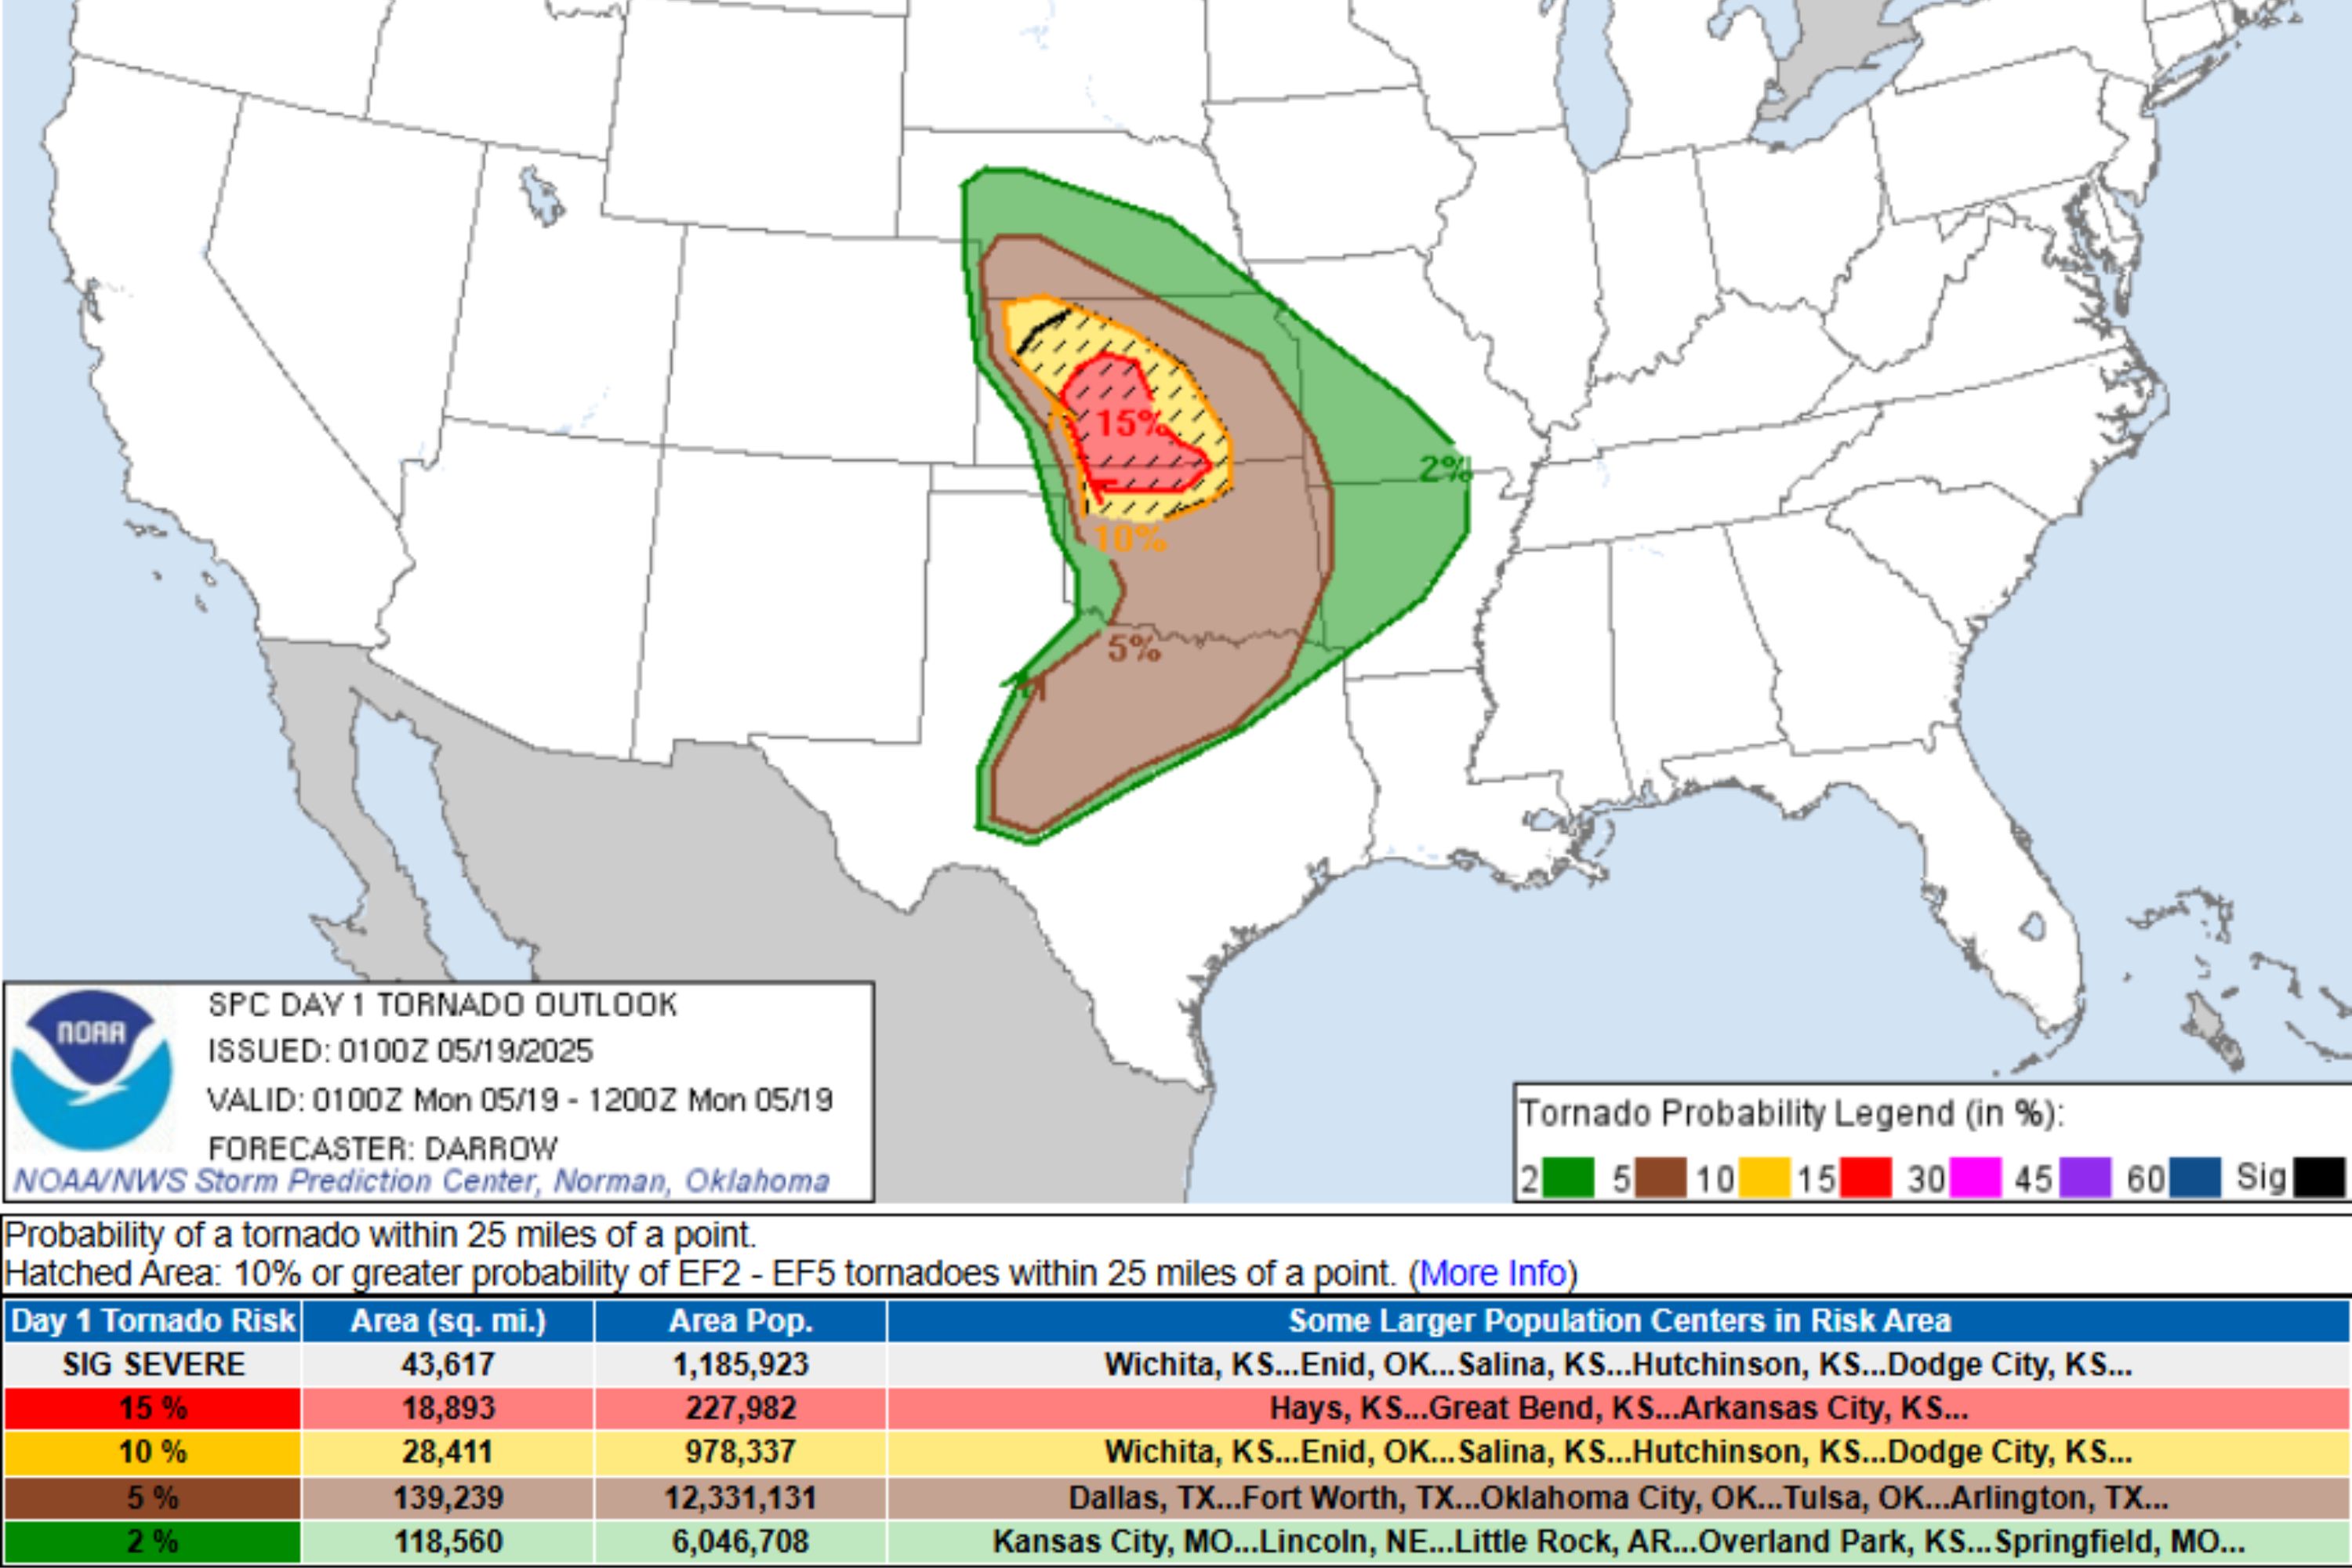
Barton County’s tornado activity runs 93% above the U.S. average, and Great Bend carries 25 recorded natural-disaster declarations against a U.S. average of 19, per City-Data’s compiled county disaster record. The most severe documented event near Great Bend struck on April 21, 2001: an F4 tornado tracked roughly 6 miles through Hoisington, about 9 miles from Great Bend’s center, holding F4 intensity for about 2 miles, killing one person, injuring 28, and destroying or severely damaging more than 285 homes.
Notable weather events on record
Buyers financing through a conventional or FHA loan in this zip should ask their insurer directly about wind and hail deductibles, since Kansas insurers commonly write separate, higher deductibles for wind and hail claims than for other perils, a detail that affects real monthly cost more than the base premium quote does.
Is Great Bend, KS prone to tornadoes? Barton County’s tornado frequency runs 93% above the national average, and the area’s worst documented event, an F4 in April 2001, caused one fatality and 28 injuries about 9 miles from the city center.
Who this market suits
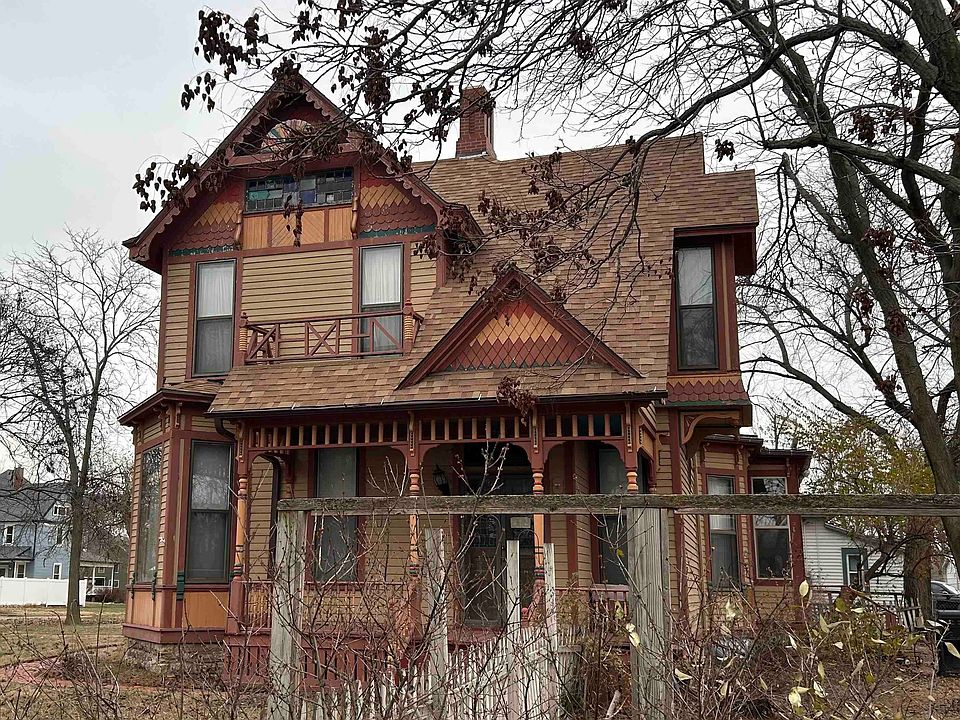
Within the zip, elementary attendance zones vary sharply: GreatSchools ratings reported through Redfin put Jefferson, Park, and Lincoln at 6 out of 10 and Eisenhower and Riley at 3 out of 10, a difference worth checking by address. This suits buyers prioritizing low entry price and steady rental demand over rapid appreciation, and it is not a walkable or transit-first market: commuters here drive alone with an average 15.2-minute commute.
How 67530 compares to nearby towns
| Town | Population | Median home value | Median rent | Property tax (mortgaged, median) |
|---|---|---|---|---|
| Great Bend (67530) | 14,489 | $126,400 | $759 | $2,552 |
| Hoisington | 2,642 | $104,404 | $982 | $2,649 |
| Ellinwood | 1,980 | $120,119 | $695 | $2,401 |
| Larned | About 3,420 | $103,854 | $777 | $2,041 |
Sources: Kansas Division of the Budget certified population; City-Data Hoisington; City-Data Ellinwood; City-Data Larned; Data USA Larned. Hoisington’s rent runs higher than its home value would suggest relative to its neighbors, worth a second look for an investor screening the four towns on cash flow rather than price alone.
What’s changing
No public agency publishes a year-by-year building-permit count for Great Bend that would show new-construction volume directly; the city’s building-inspections office issues permits case by case without releasing an aggregated dataset. The 1959 median construction year stands as the best available proxy: new single-family construction here is scarce enough that most buyers are purchasing 20th-century stock rather than new builds, and the sale of 1411 Taft St, which closed on January 15, 2026 after 427 days on market.
Comments