
How East Palo Alto Compares to the Rest of Silicon Valley
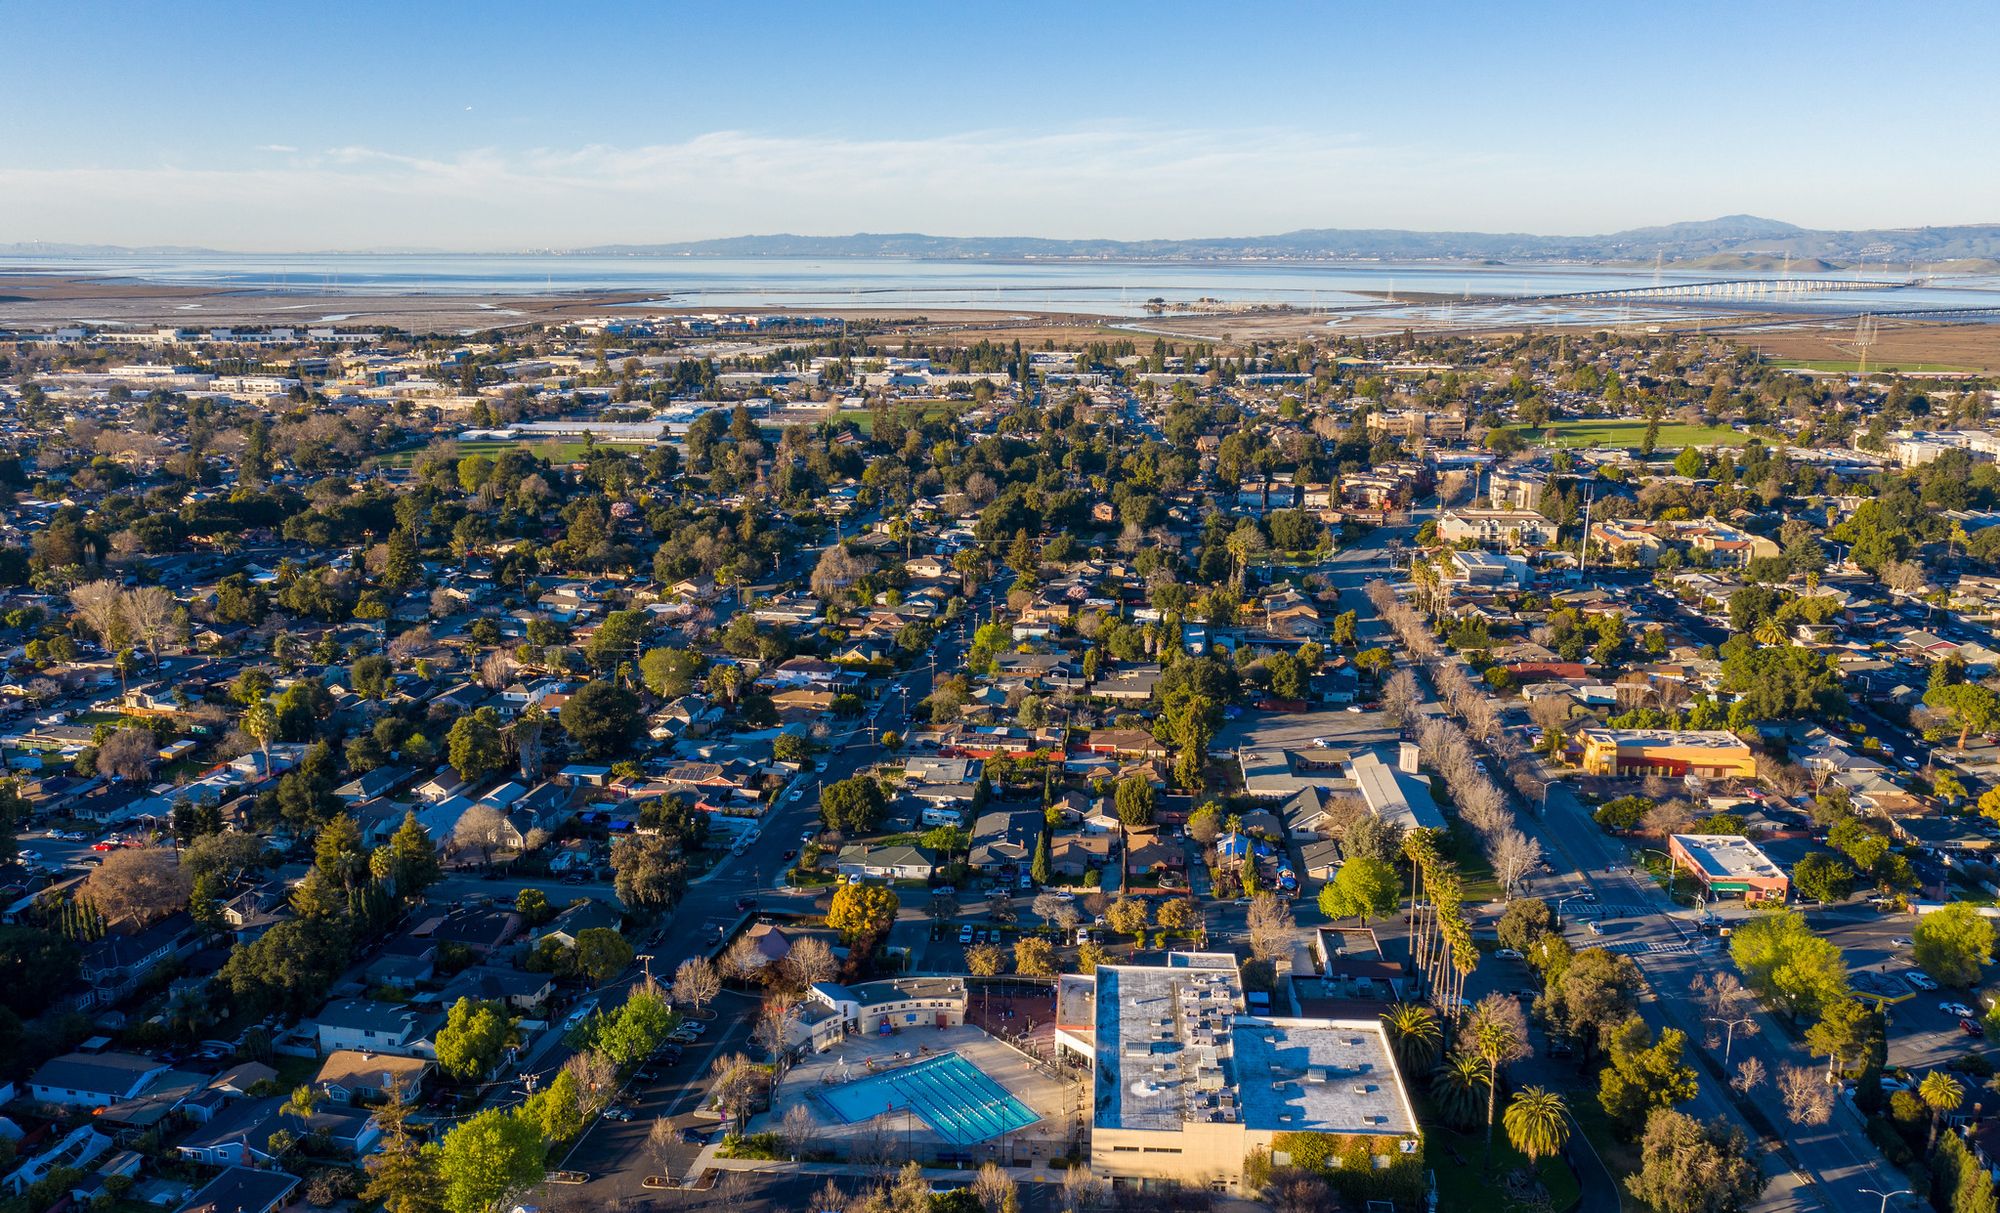
East Palo Alto’s values are drifting down slowly while Palo Alto’s are dropping much faster in percentage terms, even though the dollar gap between the two cities remains enormous. Zillow’s index shows East Palo Alto down 2.9% year over year against Palo Alto’s 12.0% decline. At the same time, Redfin’s days-on-market figure for East Palo Alto compressed from 66 days to 32 days across the same twelve months, and the market carries a “somewhat competitive” score. Those two readings aren’t contradictory: ZHVI is a smoothed twelve-month index of home value, while days-on-market measures how fast this month’s specific listings moved. A market can show a softer trailing average and a faster current sales pace at the same time, particularly with sale volumes this small.
Why East Palo Alto Is Priced Where It Is
Two structural factors explain a real share of the gap with Palo Alto and Menlo Park, beyond the ordinary story of lot size and land value: school ratings and flood exposure.
Schools and the Ravenswood district
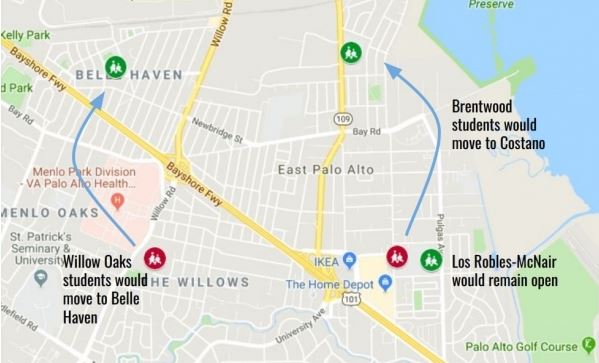
East Palo Alto’s K-8 students are zoned into the Ravenswood City Elementary School District, seven schools serving the city, according to GreatSchools. California Department of Education 2024-25 testing data, reported by Niche, shows roughly 7% of district students scoring proficient in math and 12% in reading. Cesar Chavez Ravenswood Middle carries a 4 out of 10 GreatSchools rating and is described on the GreatSchools profile as performing below average for its grade levels statewide.
The discontinuity buyers often miss: once EPA students reach high school, they attend Menlo-Atherton High, part of the separate Sequoia Union High School District, rated 8 out of 10 on the same GreatSchools scale attached to East Palo Alto listings. A single “EPA schools” rating hides that the elementary-and-middle tier and the high school tier belong to two different districts with very different outcomes.
Flood exposure and what it costs to insure against
More than half of East Palo Alto’s homes carry meaningful flood exposure, and the exact share depends heavily on which block a property sits on. Redfin’s First Street data puts 54% of East Palo Alto properties, 1,426 in total, at risk of severe flooding over the next 30 years; in the Ravenswood pocket specifically, that figure rises to 83%. The city’s floodplain construction rules sit in Ordinance #362, and the National Flood Insurance Program’s substantial-improvement rule extends the elevation requirement to the whole structure once repair or renovation costs reach 50% of a building’s market value. A 2015 FEMA remap, reported by Peninsula Press, added roughly 550 properties to the floodplain and prompted mortgage-holders on those parcels to buy flood insurance for the first time; the city has recorded 8 major flood events tied to the San Francisquito Creek levee system since 1940.
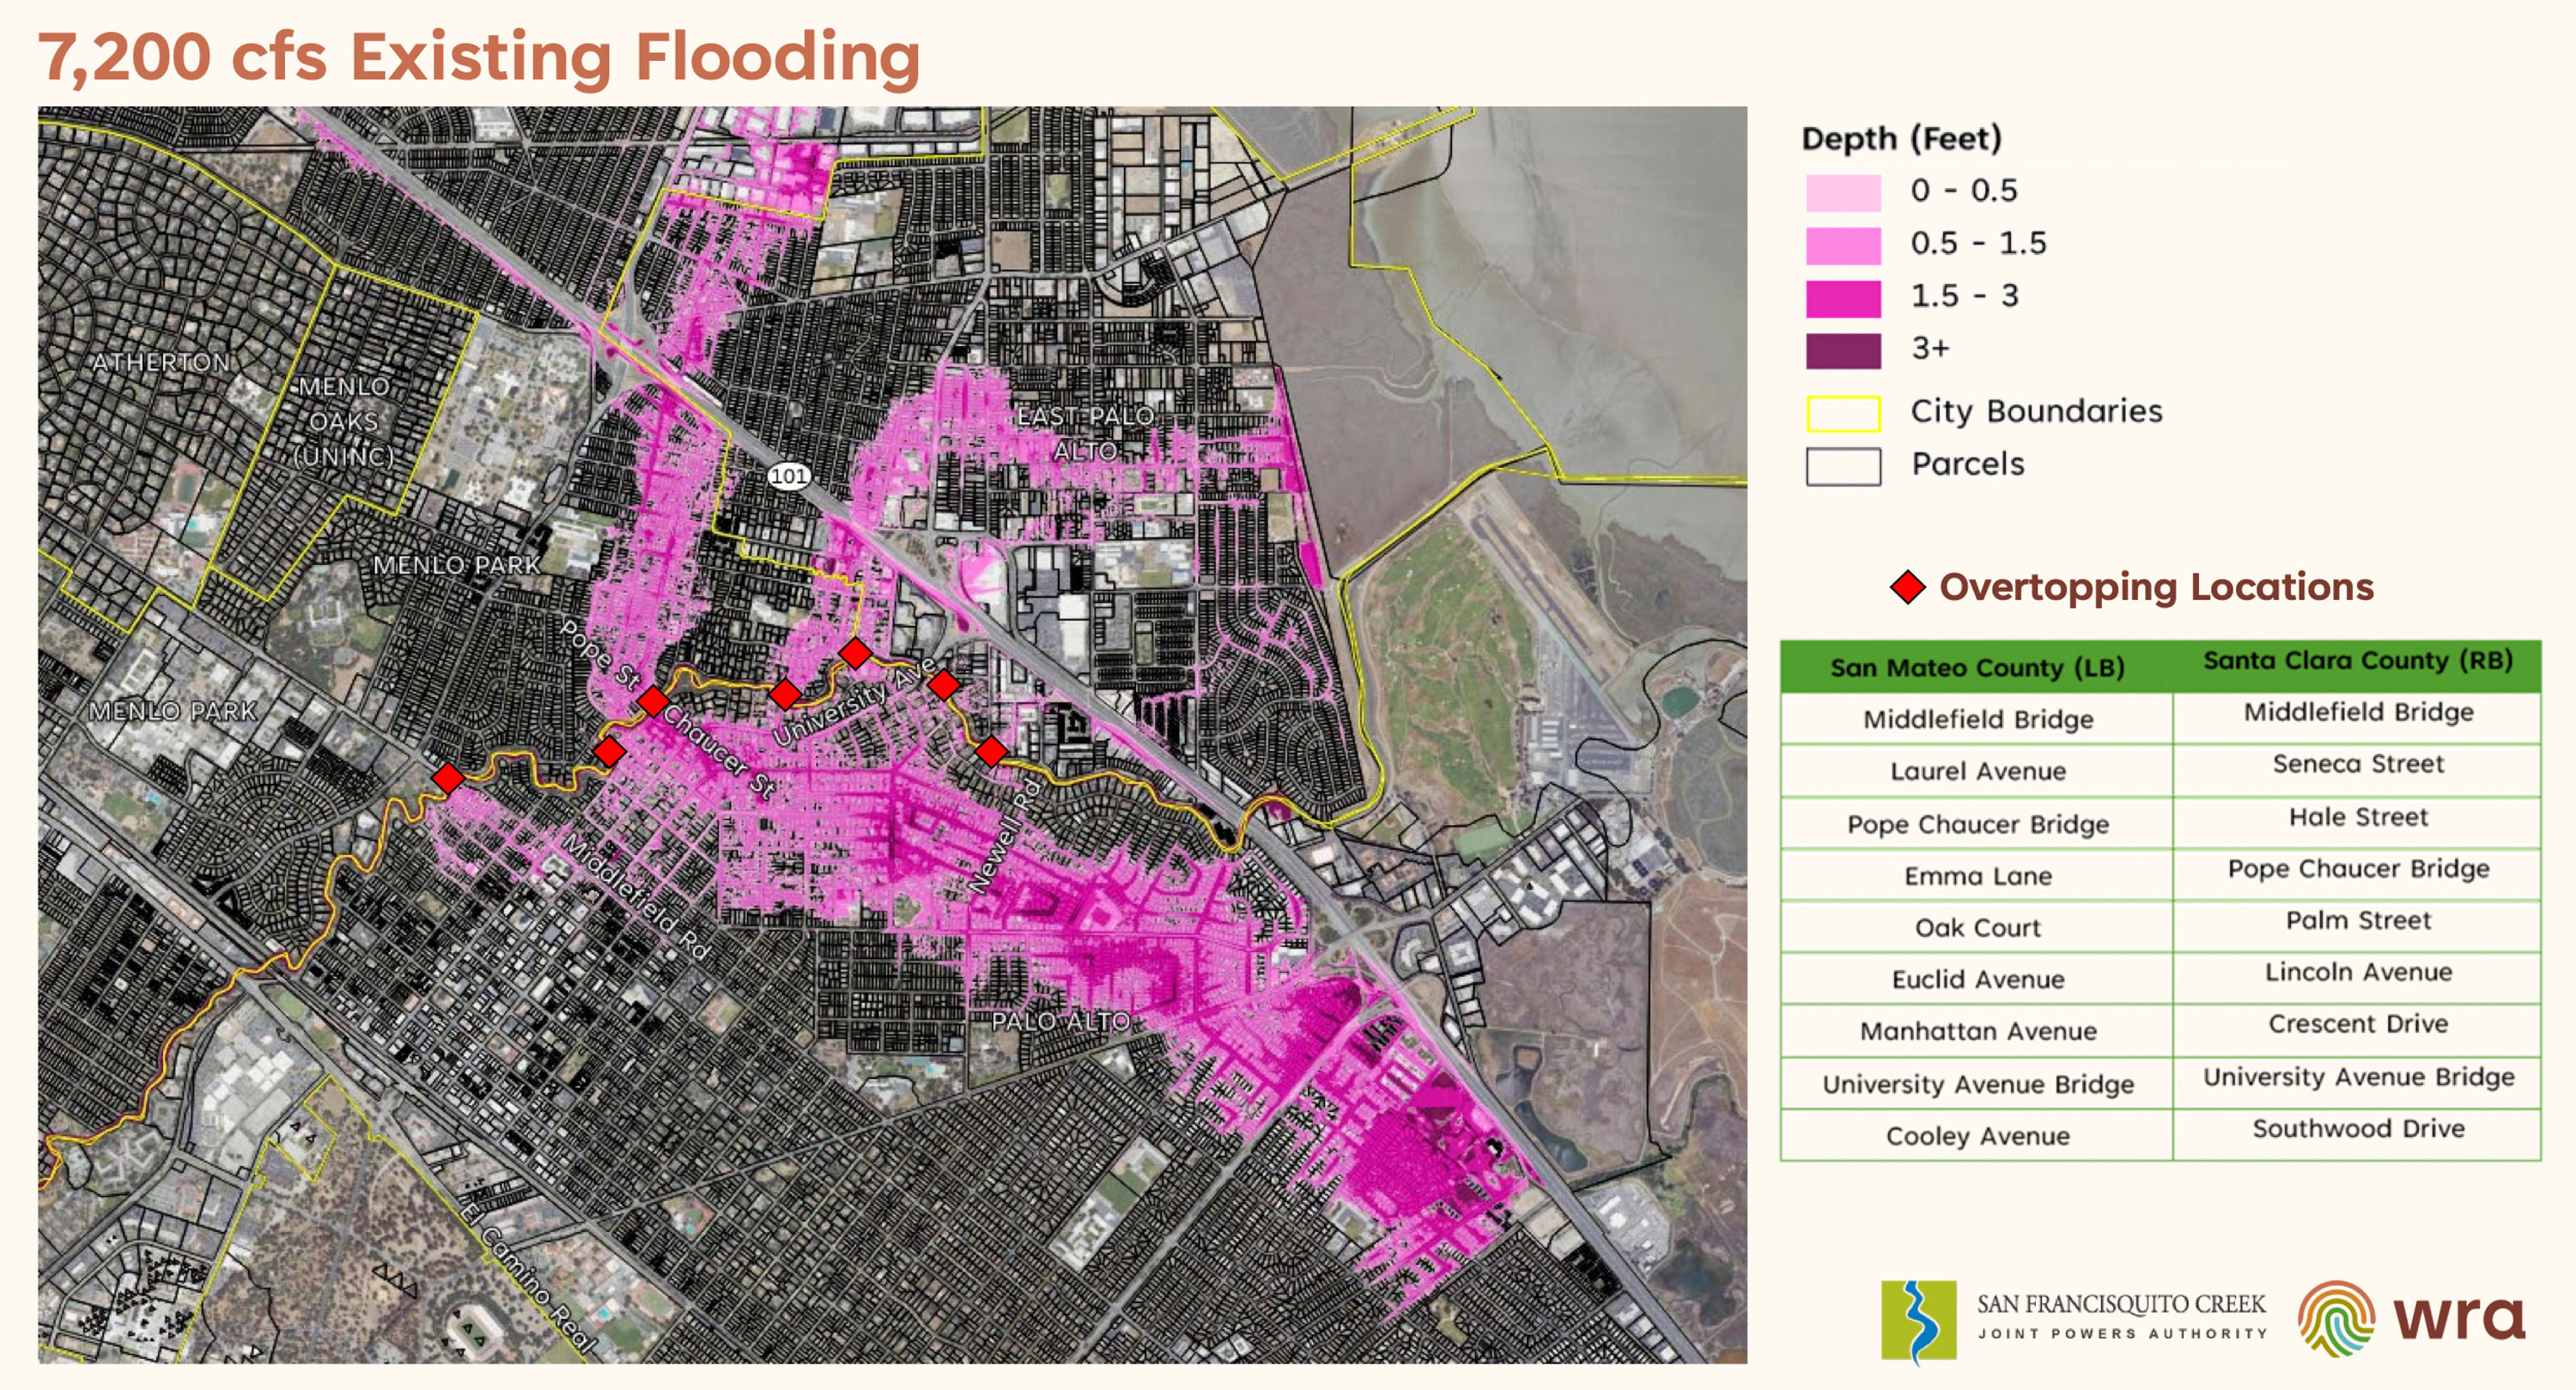
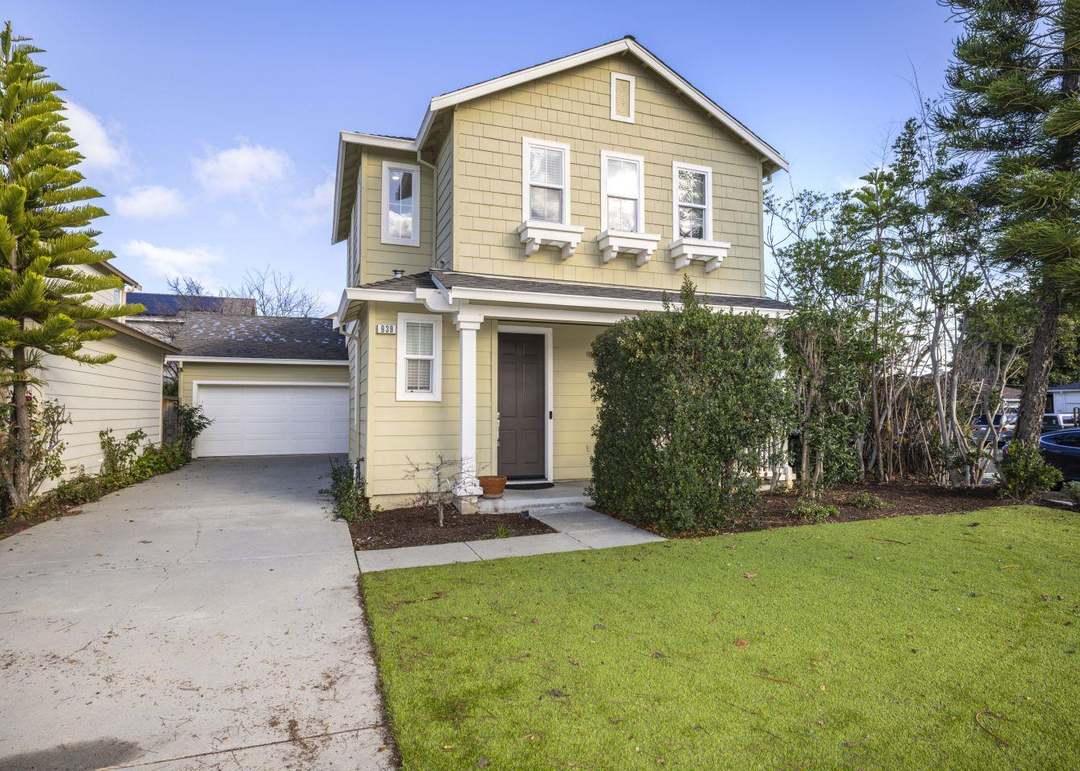
The variation is concrete at the address level. 1717 Woodland Ave, on the city’s western side, carries a Flood Factor of 1 out of 10, described as minimal risk. 111 Aster Way, nearer the University Avenue corridor, carries a 10 out of 10 rating, an estimated 80% or greater chance of the structure flooding within 30 years. Two homes in the same city, roughly two miles apart.
Is East Palo Alto in a flood zone? Large parts of it, yes. City Ordinance #362 governs floodplain construction citywide, and roughly 54% of properties carry meaningful 30-year flood risk per First Street data, but the share ranges from near zero to over 80% depending on the specific block; check the parcel, not the city average.
Between the school-rating gap and the flood-exposure gap, East Palo Alto’s roughly one-third-of-Palo-Alto pricing has a mechanical explanation for a meaningful share of that gap, alongside the region’s usual land-value gradient.
Why are East Palo Alto home prices so much lower than Palo Alto’s? Palo Alto’s ZHVI is roughly three times East Palo Alto’s. School ratings in the Ravenswood K-8 district (4/10 for the local middle school, single-digit-percent state test proficiency) and flood exposure affecting more than half of EPA parcels are two concrete, checkable contributors, alongside the region’s usual land-value gradient.
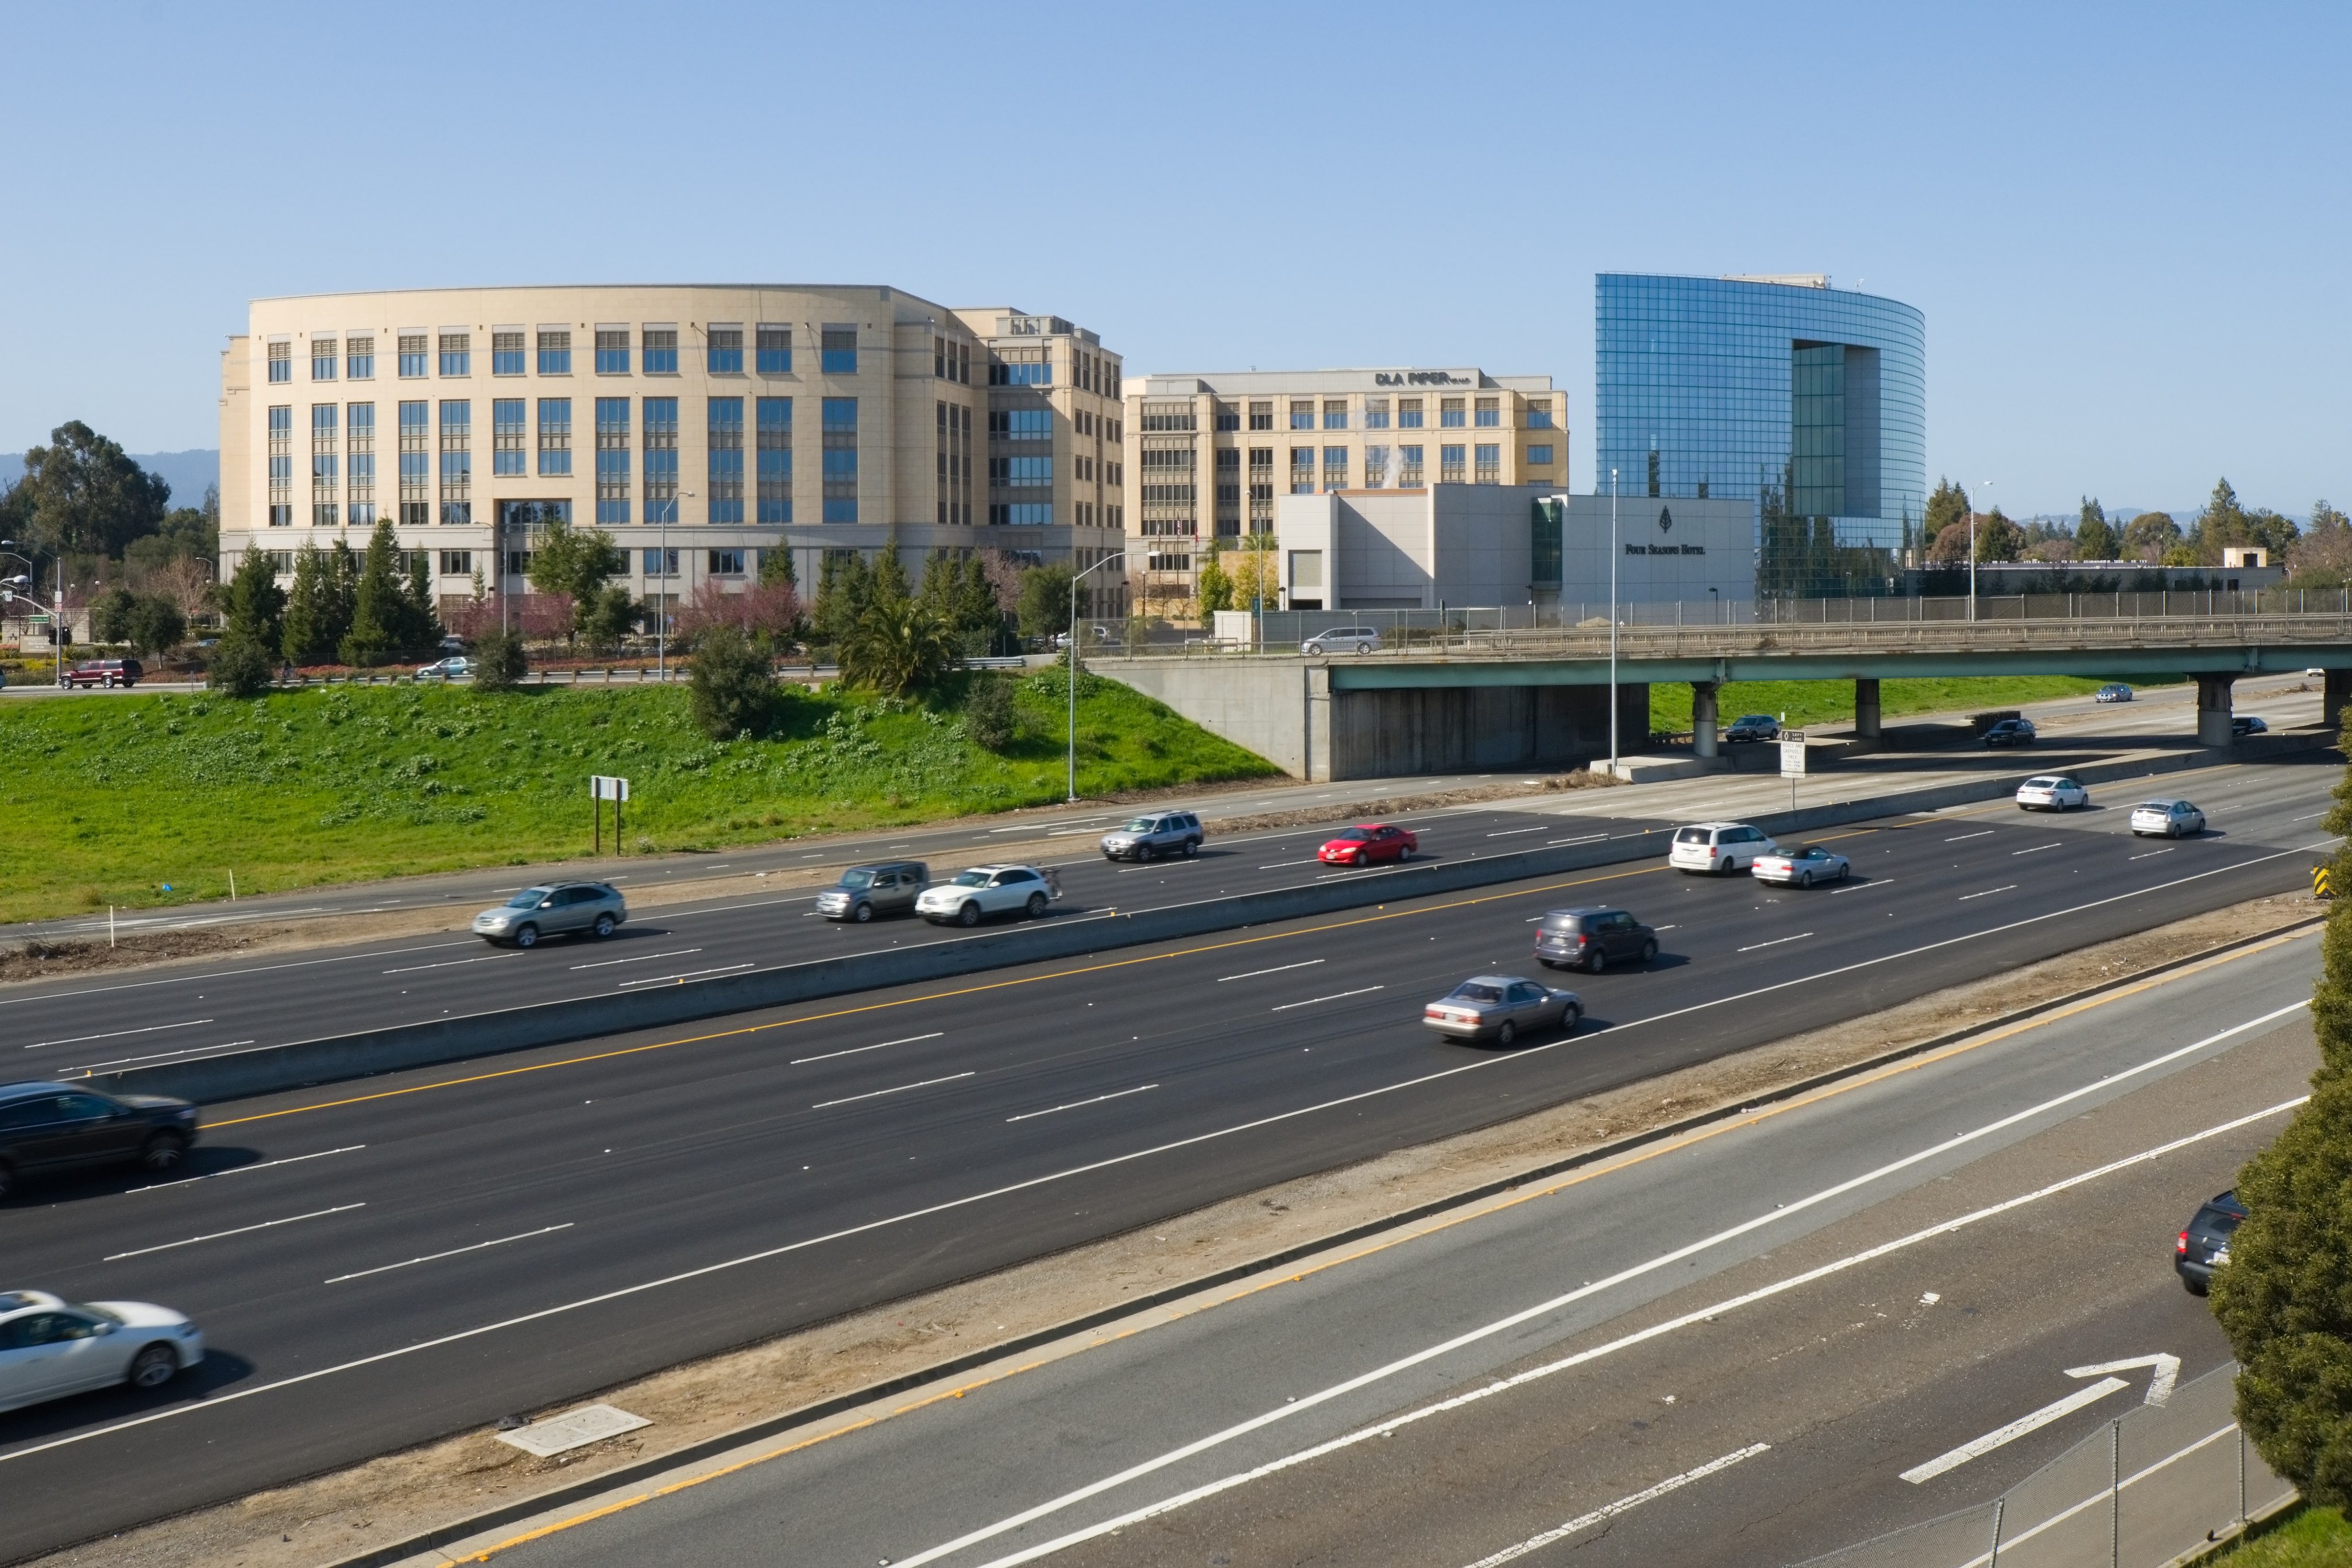
Not All of East Palo Alto Is the Same
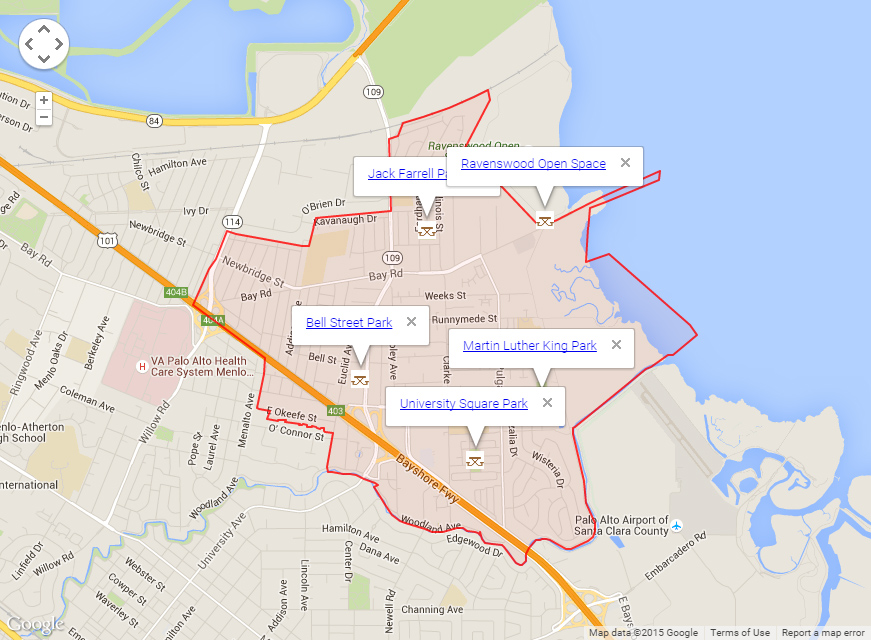
Four separately tracked pockets of the city show different price, competition, and flood profiles, so the citywide median hides real internal variation.
| Sub-area | Price / lot data | Flood exposure | Notes |
|---|---|---|---|
| Weeks | $960K median sale price (trailing 3 months); $796/sqft, down 14.6% year over year | Not separately reported by First Street | Redfin rates it “most competitive,” 10-day median time on market |
| Ravenswood / 4 Corners | Redevelopment focus area (see below) | 83% of properties at severe flood risk over 30 years | Site of the approved Ravenswood Business District/Four Corners plan |
| Woodland pocket (west side) | Represented by 1717 Woodland Ave | Flood Factor 1/10, minimal risk | Illustrates the low end of the city’s flood range |
| University Ave / Bay corridor | Represented by 111 Aster Way | Flood Factor 10/10, 80%+ estimated 30-year risk | Illustrates the high end of the city’s flood range |
Weeks trades below the citywide median and moves the fastest of the four; the Ravenswood/4 Corners pocket carries both the heaviest flood exposure and the most active redevelopment pipeline in the city.
East Palo Alto’s own ZIP code is 94303, shared with a slice of southeast Palo Alto. Citywide figures like Zillow’s ZHVI are drawn from city boundaries, not ZIP boundaries, so a search that lands on a 94303 housing-market page can blend East Palo Alto sales with pricier Palo Alto sales on the other side of the line. Redfin’s neighborhood-level pages stay inside the city boundary and are the more reliable unit for comparing one part of East Palo Alto with another.
What Could Change This: Redevelopment and Employer Proximity
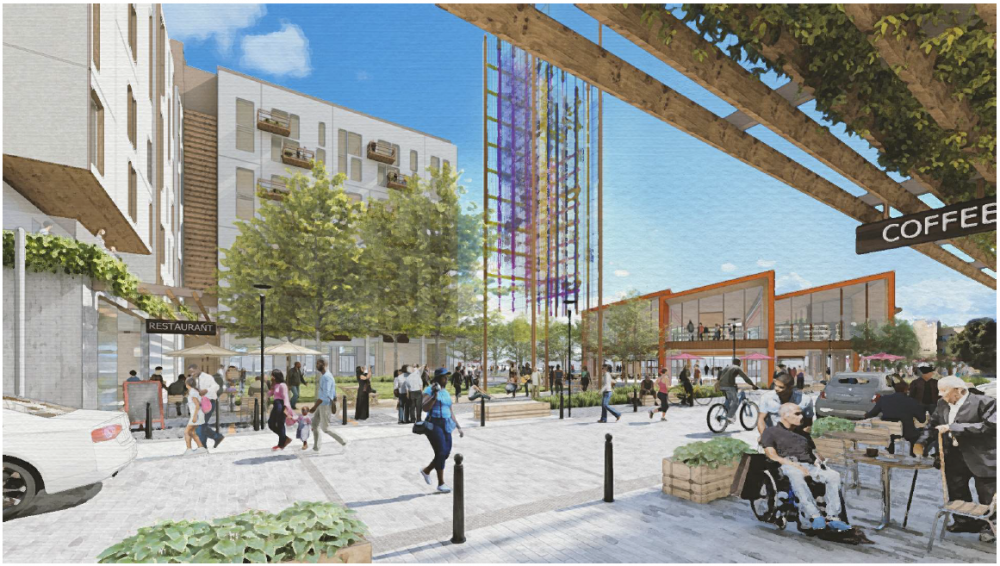
A large, recently approved redevelopment plan and continued proximity to Meta’s Menlo Park headquarters, directly across the Bayfront Expressway, are the clearest upside catalysts for East Palo Alto real estate, though both carry long and uncertain timelines.
On December 17, 2024, the East Palo Alto City Council approved an updated Ravenswood Business District/Four Corners Specific Plan, reported by Palo Alto Online. The update allows 3.35 million square feet of office and research space, 300,000 square feet of industrial space, 112,400 square feet of retail, 154,700 square feet of community and civic uses, and 1,600 housing units, up from the original 2013 plan’s 1.44 million square feet of office space, 175,910 square feet of industrial space, 112,400 square feet of retail, 61,000 square feet of civic space, and 835 housing units.
Plans at this scale in the Bay Area routinely take a decade or more between council approval and completed buildout, and the same report notes that one developer, Sand Hill Property Company, paused its application after the update added new community-benefit requirements. Treat the plan as a real, dated commitment and not as a near-term price driver.
For Investors: Rent vs. Buy
At $4,000 a month in average rent against a $1,025,050 average purchase price, East Palo Alto’s gross rental yield works out to about 4.7%, before taxes, insurance, HOA dues, or vacancy. The $4,000 figure comes from Zumper, dated May 23, 2026, which puts East Palo Alto rent 105% above the national average.
Is East Palo Alto a good rental investment? A roughly 4.7% gross yield is respectable for the Bay Area, though it sits before taxes, insurance, HOA costs, and vacancy, and flood-insurance costs will vary sharply by block, per the flood-exposure data above.
If You’re Buying, Selling, or Investing
- Buying: Check the parcel-level Flood Factor before making an offer, not just the citywide 54% figure; a property at the low end (like the Woodland Ave example) and one at the high end (like the Aster Way example) carry very different insurance and resale profiles.
- Selling: Days on market has compressed to 32 days from 66, a genuine tightening signal, but with single-digit monthly sale counts, price your listing off recent comparable sales rather than off the ZHVI trend line alone.
- Investing: Run the rent-vs-buy math on the specific unit you’re considering rather than the citywide average rent figure, and price in flood insurance separately if the address falls inside a high-exposure pocket.
Redfin’s migration data adds one data point for context: in the fourth quarter of 2025, 25% of East Palo Alto homebuyer searches were for a move out of the city, with 75% staying within the metro area. That reflects Redfin.com search activity rather than confirmed relocations, and it excludes rental searches entirely.
The single biggest limitation across every figure in this page is transaction volume. East Palo Alto sells single-digit numbers of homes most months. Any month-over-month or quarter-over-quarter percentage change built on fewer than 10 sales should be read as directional, not precise.
Comments