
Why “the national rent” isn’t one number
ApartmentList’s lease-transaction index puts the national median at $1,385 for June 2026, covering rent actually paid on new leases across its platform. Zumper’s one-bedroom index reports $1,526 for the same month, built from asking prices on active listings. ApartmentAdvisor puts the national one-bedroom median at $1,550, also asking-price based, across 100 major cities. Apartments.com reports a national average of $1,645. That’s a $260 spread between the lowest and highest figure. It exists because a median lease-signing price, a median asking price, and an average asking price are three different measurements applied to overlapping but not identical data sets.
| Tracker | 1BR figure (June 2026) | What it measures |
|---|---|---|
| ApartmentList | $1,385 | Median rent on new leases, from real lease transactions |
| Zumper | $1,526 | National one-bedroom asking-rent index |
| ApartmentAdvisor | $1,550 | Median asking price, 100 major U.S. cities |
| Apartments.com | $1,645 | Average (not median) one-bedroom rent, 2,400+ cities |
Comparing your own rent to any single one of these numbers without knowing which measurement it uses will misread your position in the market.
Government figures move on a separate track entirely. HUD’s FY2026 Fair Market Rent schedule sets a one-bedroom at $757 for the Anniston-Oxford, Alabama metro area, effective October 1, 2025. That figure is the federal 40th-percentile benchmark used to set housing voucher payment standards there, not a listing price pulled from a search platform.
What “affordable” actually means before you sign
The guideline to spend no more than 30% of income on rent has decades of federal housing policy behind it. It’s also a target a large share of renters miss. In 2024, 49.4% of U.S. renter households spent more than 30% of their income on housing, according to Congressional Research Service analysis of Census Bureau American Community Survey data. The rule describes a policy target. The data shows nearly half of renters exceed it. Both things are true at once.
Is the 30% rent rule realistic anymore? It describes what federal housing programs use as an affordability threshold, but nearly half of U.S. renter households exceed it, according to 2024 Census data. Use it as a planning anchor, and treat going somewhat above it as common rather than alarming.
The trade-off behind every lower rent
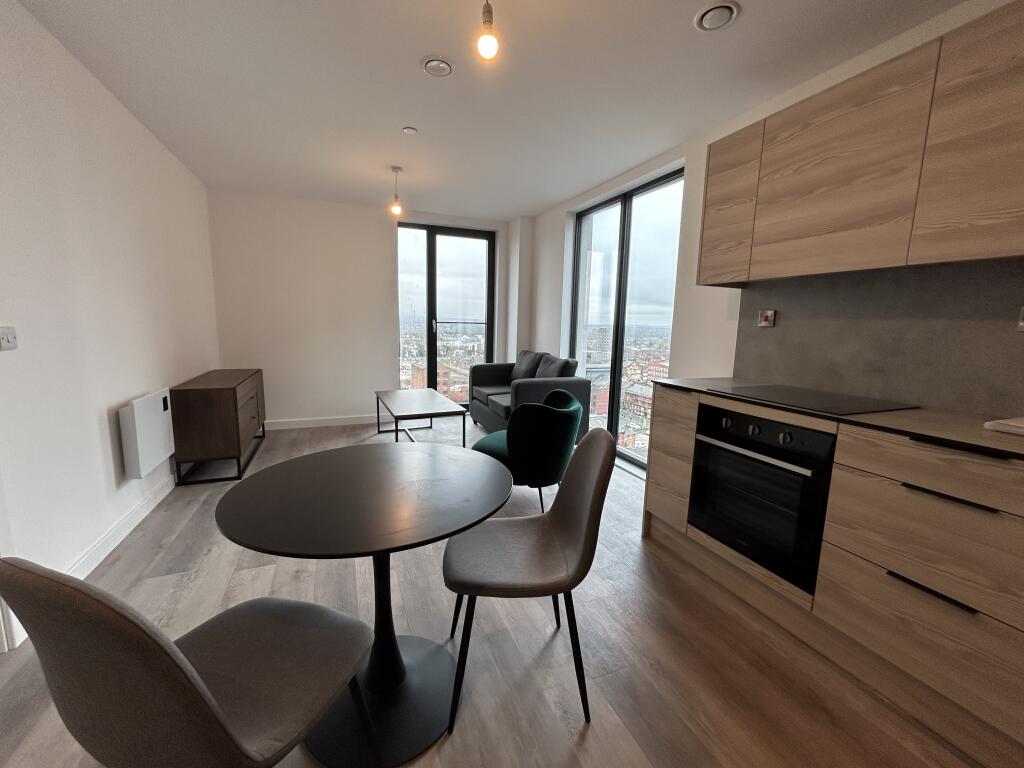
A cheaper one-bedroom in the same metro almost always costs something other than money.
| Rent relative to metro median | Typical floor/access | Laundry | Unit age/condition | Natural light |
|---|---|---|---|---|
| At or above median | Elevator or ground floor | In-unit | Newer construction or recent renovation | Multiple exposures common |
| 10 to 20% below median | Upper floor, walk-up common | Shared in-building | Older building, dated finishes | One exposure, may face a wall or airshaft |
| 20% or more below median | Walk-up, often 4th floor or higher | Laundromat or coin-op off-site | Pre-1980s construction, deferred maintenance likely | Limited, sometimes one small window |
The unit priced 20% under median rent carries a different bundle of daily realities than the median-priced unit. Whether that bundle works depends on how much a fourth-floor walk-up and an off-site laundromat matter to your routine.
Is it worth taking a smaller or older unit to save money? Only if the specific trade-off (floor access, laundry location, unit age) is one you’d tolerate even without the discount. A walk-up on a bad knee, or a laundromat with no car, turns a paper savings into a daily cost.
Every trade-off table looks reasonable on a screen. What it doesn’t show is how a fourth-floor walk-up feels after a grocery run in July.
Two tactics that move the number, and one that doesn’t need a section

Splitting rent with a roommate lowers individual cost immediately for anyone who can share a lease. Timing matters too: national vacancy sits at 7.2% with a 30-day average time-to-lease, and prices historically soften after the summer peak. No verified dollar figure exists for exactly how much off-season signing saves, so none is claimed here.
Subsidized and income-restricted paths worth checking
Low-Income Housing Tax Credit properties, known as Section 42 housing, set aside units for households at or below 50% or 60% of area median income, under federal rules requiring either 20% of units at the 50% threshold or 40% of units at the 60% threshold. Rent in a qualifying unit is capped at 30% of that imputed income level, not the tenant’s actual income, based on HUD income limit data. These properties aren’t listed on major rental platforms the way market-rate units are. They’re typically found through a state housing finance agency’s LIHTC property list or a local public housing authority.
Do LIHTC or Section 42 apartments have long waitlists? It varies by property and metro. Waitlists exist, but shorter or closed lists appear too, and availability isn’t reliably reflected on general rental search platforms, so checking directly with a state housing finance agency or a property’s leasing office is the only way to know current status.
Does this apartment search look different for you?

| Renter type | Biggest lever available | Biggest constraint | Best-fit tactic |
|---|---|---|---|
| Student | Shared or by-the-bed leasing near campus | Limited income, no established credit history | Look for student-specific or co-living leases with individual liability, not one shared lease |
| Relocating professional | Lease-length flexibility, willingness to compromise on neighborhood | Needs to commit sight-unseen or on a short visit | Prioritize a short-term or month-to-month option first, then re-lease once local knowledge improves |
| Solo renter, can’t split a lease | Unit-age and floor trade-offs | No roommate to split cost with | Work through the trade-off table directly, since the biggest lever available to shared renters isn’t available here |
Spotting a listing that’s cheap for the wrong reason
| Signal | Why it’s risky | Verification action |
|---|---|---|
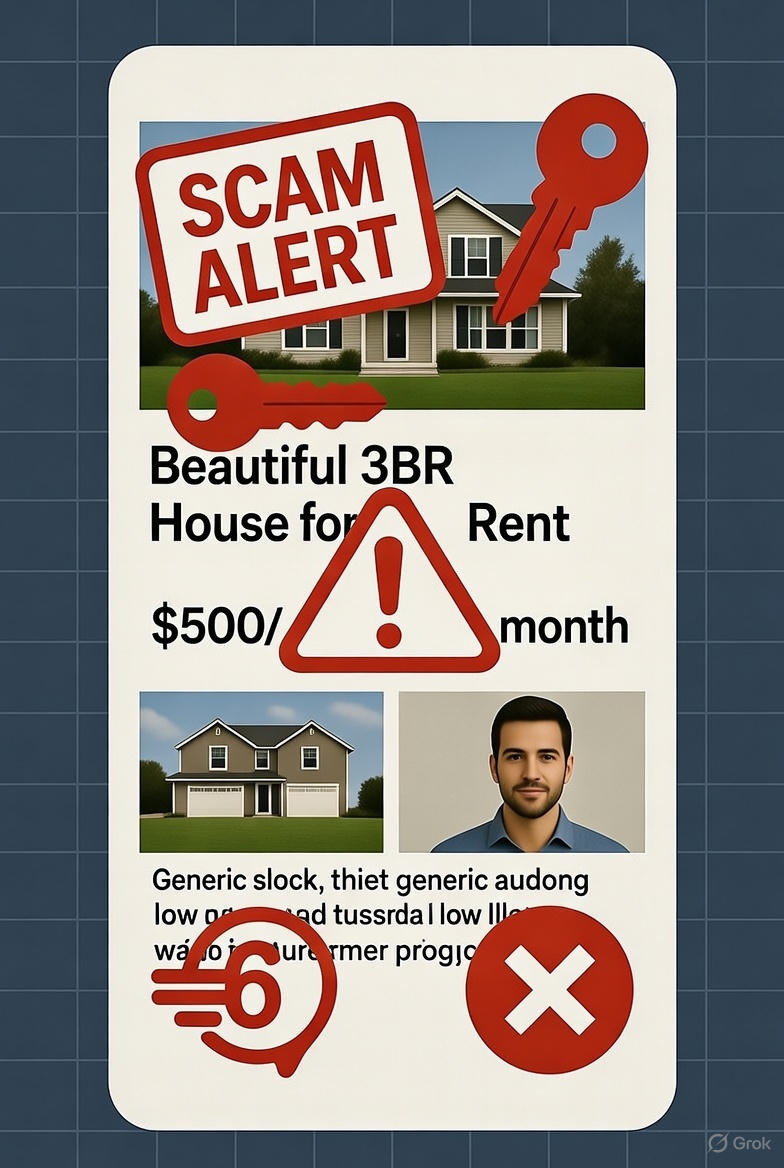
| Rent priced well below comparable units in the same building or block | May indicate a fake listing designed to collect deposits before disappearing | Compare against at least two other active listings on the same street; a gap of 20% or more with no stated reason warrants scrutiny |
| Payment or deposit requested before an in-person or live video tour | Common structure in wire-transfer rental scams | Never send money before viewing the unit in person or on a live video call with the person present in the space |
| Photos that appear staged, generic, or reused across multiple city listings | Indicates a copied listing rather than the actual unit | Reverse image search the primary photo; identical photos across different cities or prices is a clear flag |
| Landlord or agent unwilling to provide a verifiable business address or management company name | Makes it hard to confirm who controls the unit | Ask for the property management company name and confirm it independently, not through a number given only in the listing |
How do I tell if a listing price is fake? Compare it against at least two nearby active listings; if it’s 20% or more below them with no stated reason, and the poster asks for money before a live viewing, treat it as fraudulent until proven otherwise.
What to check before the lease is signed

- Total monthly cost, not just rent. Add utilities, parking, and any mandatory fees (trash, amenity, pet) to the base rent before comparing two units.
- Security deposit and application fee amounts. These vary by state and property; confirm the exact figures in writing rather than assuming a standard amount.
- What’s included versus billed separately. Water, trash, and internet arrangements differ by building, and an affordable-looking rent with $150 a month in separate utility bills costs more than a higher all-inclusive rent.
- Lighting and noise at different times of day. A daytime tour won’t show a unit facing a bar’s back entrance at 11 p.m.
- Water pressure and storage. Run the shower and check closet space in person; neither shows up in photos.
In genuinely tight-supply metros, none of this closes much of a gap. San Francisco’s one-bedroom rent climbed to a record $4,060 in June 2026, up roughly 22% year over year according to Zumper’s report, which frames the increase as supply-driven rather than something a lease-length choice or a fourth-floor unit fixes. The trade-off table still applies there; the percentage saved by accepting a worse unit is simply smaller.
Comments