
What Counts as Cheap Where You Live
A $1,200 one-bedroom is a bargain in Seattle and roughly the going rate in Kansas City, so the useful comparison is to the local market, not the national number. Two major trackers put the national figure close but not identical in June 2026: Zumper’s median is $1,526, and Apartments.com’s CoStar-sourced average is $1,645. This guide uses Zumper’s metro-level table throughout, since it publishes per-city figures rather than a single blended average.
| Metro | Avg. 1BR rent (June 2026) | Vs. national median |
|---|---|---|
| Shreveport, LA | $720 | 53% below |
| Wichita, KS | $750 | 51% below |
| Memphis, TN | $900 | 41% below |
| Kansas City, MO | $1,140 | 25% below |
| National median (100 metros tracked) | $1,526 | baseline |
| Denver, CO | $1,570 | 3% above |
| Seattle, WA | $1,980 | 30% above |
| New York, NY | $4,660 | 205% above |
Anything within about 10% of the national median counts as ordinary pricing; the real savings sit in markets running 25% or more below it, the tier Kansas City, Memphis, Wichita, and Shreveport currently occupy. In Wichita, Kansas, specifically, the median one-bedroom asking rent was $750 for the week ending June 29, 2026, up 2.7% from the prior month but still down 3.8% year over year.
For personal budgeting, HUD’s own affordability threshold holds that housing should cost no more than 30% of gross income, a standard that traces to 1969’s Brooke Amendment (25%), raised to 30% in 1981. Applied to a $750 Wichita rent, that means a household income of roughly $30,000 a year clears the threshold comfortably; the same math on a $1,526 median rent needs closer to $61,000.
Is a studio cheaper than a 1-bedroom?
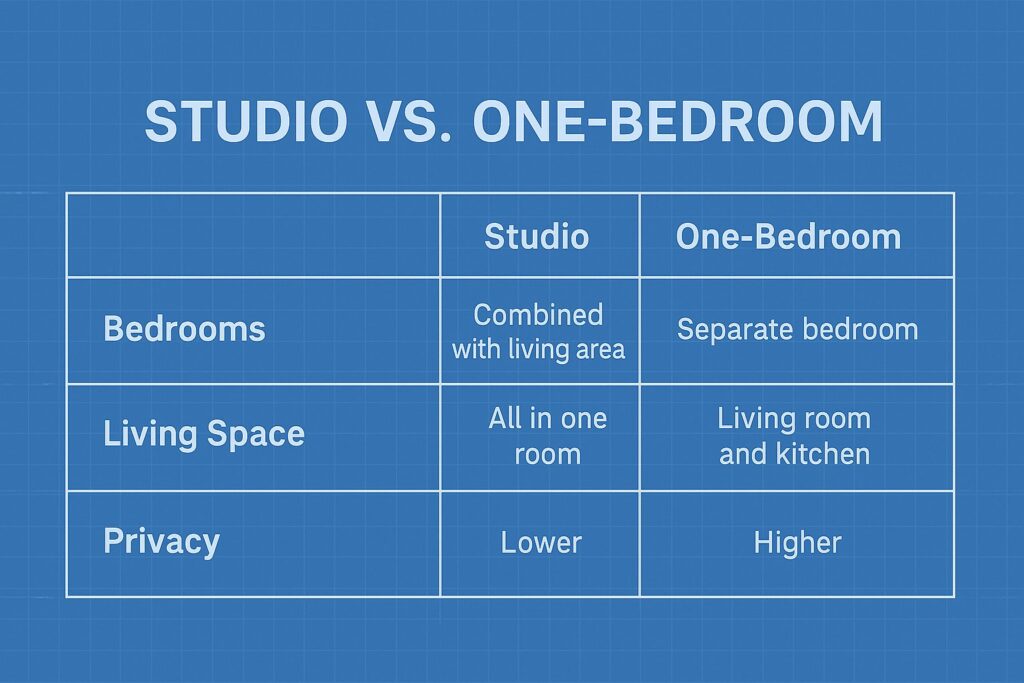
In most markets, yes, though the gap is inconsistent. In New York, Zumper’s city-level data put the median studio at $3,812 against $4,568 for a one-bedroom in mid-2026, a gap of roughly $756. Smaller and mid-sized markets often show a narrower spread, so check the local studio listing directly before assuming the saving is worth losing the separate bedroom.
The Real Cost of a “Cheap” Listing
Two one-bedrooms priced $150 apart on the listing page can cost the same once utilities are added, because rent alone is not the full monthly cost. The U.S. Energy Information Administration’s data, as compiled from EIA Form EIA-861, puts the average American residential electric bill at about $150 a month; apartments, with less square footage and shared walls, typically sit toward the lower end of that range.
| Unit A | Unit B | |
|---|---|---|
| Rent advertised | $1,400 | $1,550 |
| Electricity (tenant-paid, EIA national average) | ~$150 | included |
| Water, gas, trash | tenant-paid, amount not disclosed | included |
| Effective monthly minimum | $1,550 or more | $1,550 |
Unit A’s advertised $1,400 stops being the cheaper option the moment its tenant-paid electricity is added back in, before water, gas, or trash are even counted. Those three costs vary too much by building and city for a reliable national figure; ask the leasing office for the previous tenant’s average bill before comparing two listings.
If a listing doesn’t include utilities, is the lower rent still cheaper?
Only if the gap is wider than the electric bill, roughly $150 a month nationally per EIA data, plus whatever water, gas, and trash the lease doesn’t cover.
Where the Below-Median Listings Come From
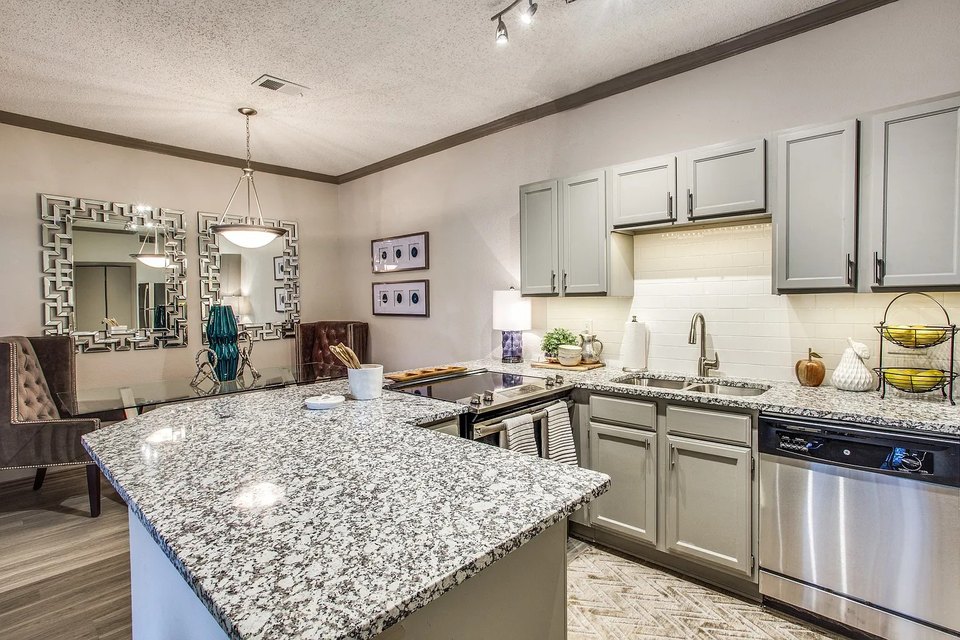
Most below-median one-bedrooms surface on the same handful of large listing sites, through a roommate split, or via a property that discounts rent for an income restriction, covered in the next two sections. Zillow, Apartments.com, and Apartment List cover the largest share of standard listings and are worth checking the day new inventory posts, since the cheapest units in a given building are usually the first to go. Splitting a two-bedroom with a roommate is the most common way renters push their effective one-bedroom-equivalent cost down, though it trades away the privacy a true one-bedroom offers.
Red Flags on Below-Market Listings
A one-bedroom priced well under the metro average is not automatically a scam, but it is the single biggest predictor the FTC cites for one. The FTC’s December 2025 analysis found nearly 65,000 reported rental scams since 2020, totaling about $65 million in losses, with a median loss of $1,000 per report. Roughly half of the scams reported in the twelve months ending June 2025 started with a fake ad on Facebook, and renters ages 18 to 29 were three times more likely than other adults to report losing money.
- Rent far below comparable units nearby with no explanation offered for the gap, whether age, condition, or program restriction.
- Pressure to send a deposit or application fee before an in-person or live video viewing.
- A request for wire transfer, gift cards, or cryptocurrency instead of a traceable payment method.
- The same address listed elsewhere for sale, not for rent, or under a different landlord’s name or number.
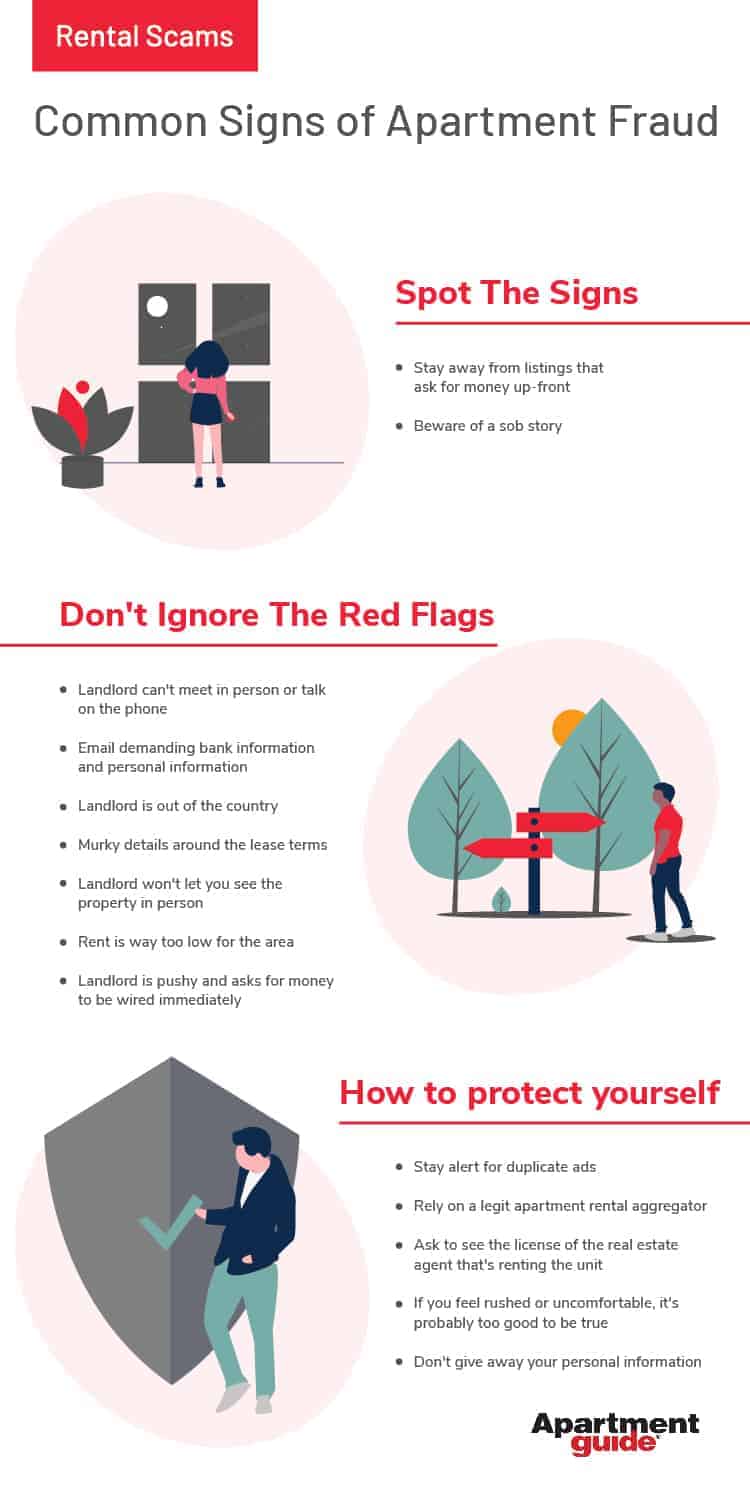
The FTC recommends searching the address online before applying: a listing that appears twice, once for rent and once for sale, or under two different contact numbers, is the clearest single tell in its dataset.
How can I tell a cheap listing is a scam?
Check the four flags above first. If the landlord refuses a live video call or in-person tour and asks for money before either, treat it as a scam regardless of how good the listing photos look.
Income-Restricted and Assistance Programs
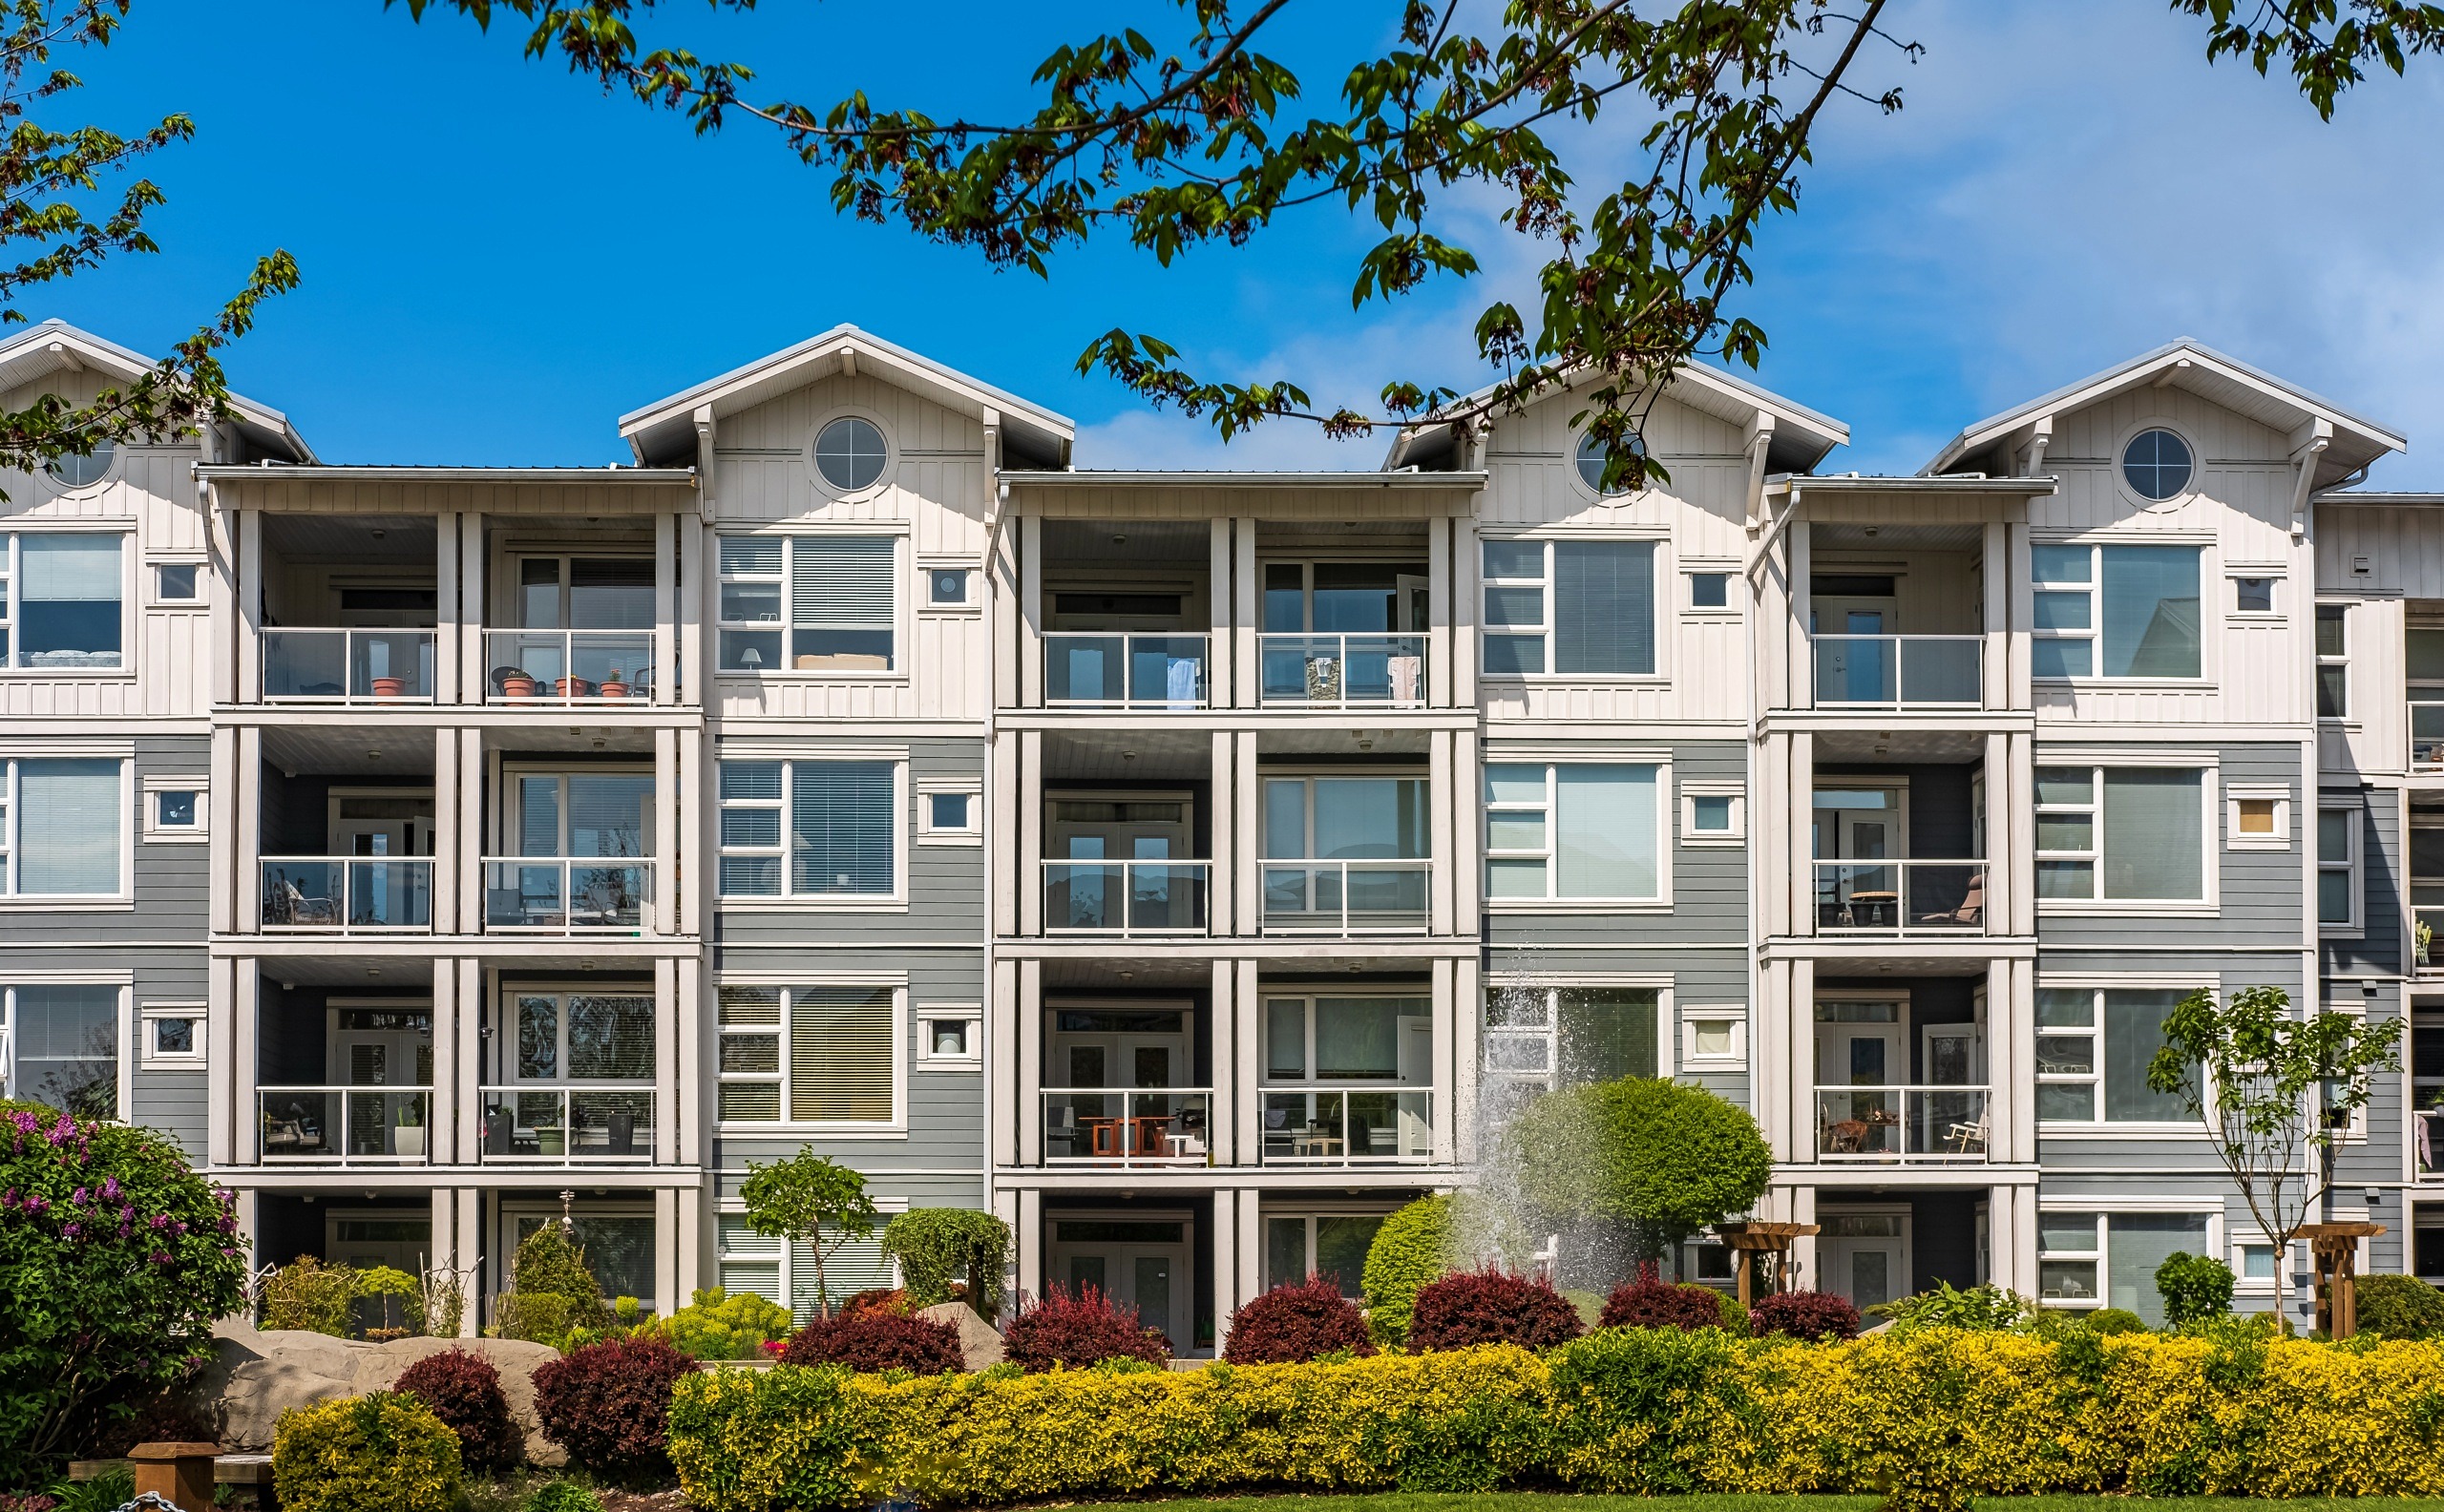
A one-bedroom in a Section 42 building can rent for well under market because the rent is capped at 30% of a set income tier: 50% or 60% of the area’s median income (AMI). Properties built under the federal Low-Income Housing Tax Credit program, commonly called Section 42, must reserve at least 20% of units for households at or below 50% AMI, or at least 40% for households at or below 60% AMI. Rent is tied to the unit’s designated income tier, not the tenant’s current paycheck, so a raise after move-in does not disqualify an existing tenant. Each LIHTC building manages its own waiting list and annual recertification; HUD does not enroll applicants centrally.
| Program | Income eligibility | How to apply |
|---|---|---|
| LIHTC/Section 42 unit, 50% AMI tier | Household income at or below 50% of area median income | Apply at the property directly |
| LIHTC/Section 42 unit, 60% AMI tier | Household income at or below 60% of area median income | Apply at the property directly |
| Housing Choice Voucher (Section 8) | Set locally by the Public Housing Authority, generally within 50% to 80% AMI | Apply through the local PHA; many waitlists are long or closed |
| HUD Resource Locator | Not a program, a free search tool | Maps nearby LIHTC properties and PHAs by address |
A household earning at or below 50% of local area median income clears the tightest tier on this table; the loosest, 80% AMI under some voucher rules, reaches well into what many renters consider a middle income.
Do I qualify for income-restricted housing?
Eligibility depends on your household income against your county’s area median income, which HUD publishes and uses to set both the LIHTC tiers and local voucher limits. The HUD Resource Locator maps nearby LIHTC properties and PHAs where you can check current limits and apply directly.
When Cheap Becomes a Bad Deal
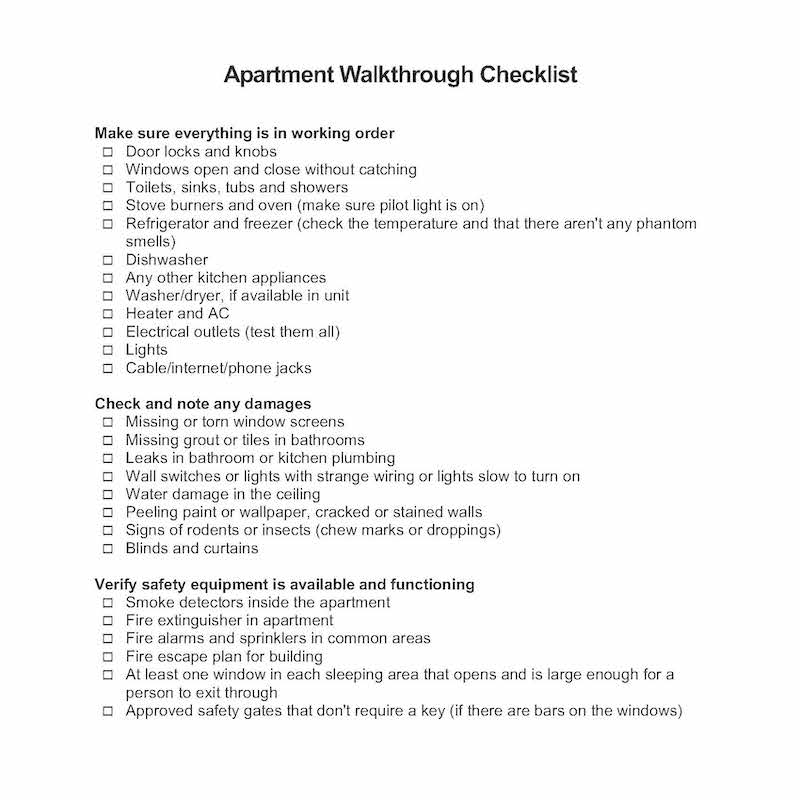
A rent that sits 25% or more below comparable units nearby sometimes signals a real trade-off: deferred maintenance, an unresponsive landlord, or a pest problem the listing doesn’t mention. Ask directly why the unit is priced below its neighbors, request a walk-through in daylight, and check with the local housing inspector for open code violations before signing.
Timing Your Search
Fall and winter are widely described as the cheapest season to rent, but no current rent report puts a reliable number on how much cheaper, so treat the claim as directional.
Is rent cheaper in the off-season?
Likely somewhat, based on directional data from major rent trackers, but no current source publishes a reliable percentage discount. Weigh it as a minor factor behind total cost, unit quality, and program eligibility.
Comments