
Where It Is and How You Get There
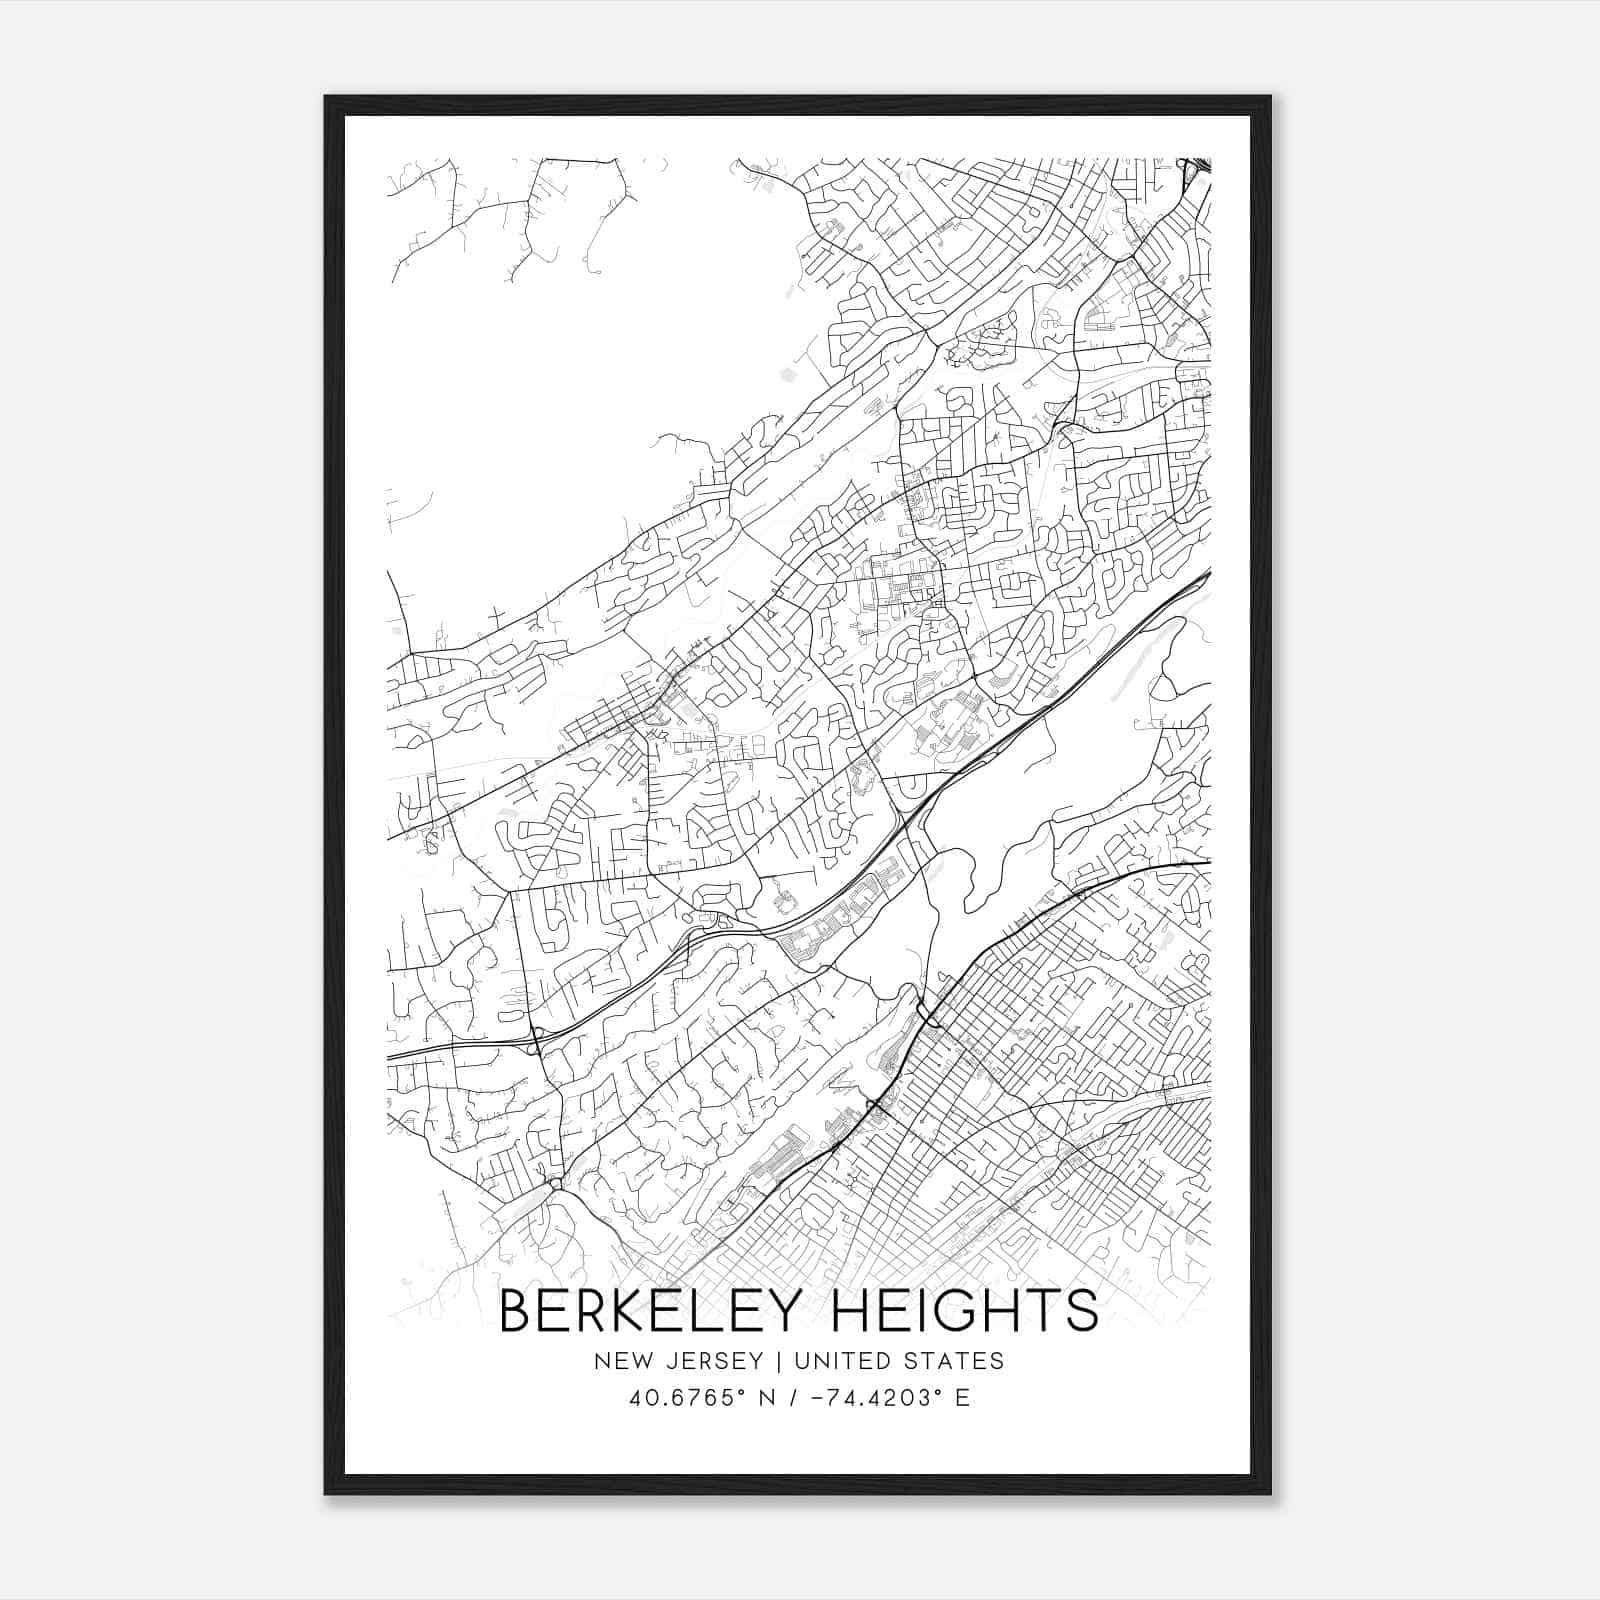
Most Berkeley Heights residents drive to work: 81.9% travel by private automobile (77.3% drive alone, 4.6% carpool), while 10.3% use public transit, according to the Union County Division of Planning’s township profile. The township sits in the westernmost part of Union County, in the Watchung Mountains, bordered by Somerset and Morris counties to the south and west, with Route 78 running along the southeastern edge.
The township is served by NJ Transit’s Gladstone Branch at Berkeley Heights Station, plus Bus Route 986. During peak commuting hours, electrified Midtown Direct trains run straight through to New York Penn Station; at other times, Gladstone Branch riders change trains at Summit to continue toward Penn Station or Hoboken. The current average commute, 36.8 minutes, runs about 25% longer than the Union County average and roughly 40% longer than the national average.
How long is the actual commute to New York?
On average, 36.8 minutes door to platform, per 2024 Census data, running about six minutes longer than the Union County norm. Trains at peak hours run direct to Penn Station; off-peak trips typically require a change at Summit.
Housing and Cost of Living
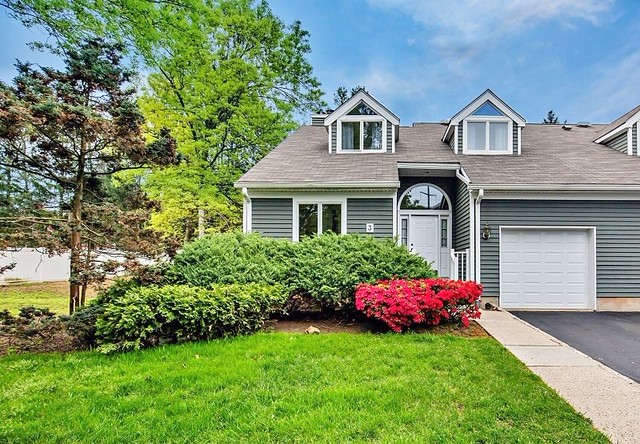
The current median value of an owner-occupied home in Berkeley Heights is $789,400. Median household income is $204,658, and per capita income is $97,560, both close to double the Union County figures.
Why Inventory Is Tight
Housing tenure explains part of the price level. The Union County planning profile puts owner-occupancy near 95%, with 88% of units classified as single-unit detached homes, a mix that has stayed fairly stable: total housing units grew from 4,630 in the mid-2010s estimate to 4,905 in the 2024 estimate, an increase of under 300 units across roughly eight years. A town where almost all homes are owner-occupied, single-family, and rarely turn over produces exactly the price pressure the current median reflects.
Is the housing market competitive?
Owner-occupancy has run near 95% and the housing stock grew by under 300 units in almost a decade, so listings turn over slowly and buyers compete for a small, fairly static supply.
Comparing Berkeley Heights to nearby towns people cross-shop
| Town | Median Home Value (2024) | Average Commute | Homeownership Rate |
|---|---|---|---|
| Berkeley Heights | $789,400 | 36.8 min | ~95% (2012-2016 estimate) |
| New Providence | $769,900 | 31.8 min | 75.8% |
| Summit | $994,500 | 33.5 min | 68.3% |
Sources: Berkeley Heights figures per Census Reporter and the Union County planning profile above; New Providence and Summit figures per Data USA’s Census ACS 2024 profile for New Providence and its Summit profile.
Berkeley Heights carries a shorter commute than Summit but a longer one than New Providence, and its price sits between the two, closer to New Providence than to Summit. Its ownership rate, while measured on an older survey vintage, points to a market with fewer rentals and less turnover than either neighbor.
Is Berkeley Heights expensive compared to nearby towns?
At $789,400, its median home value lands below Summit’s $994,500 and just above New Providence’s $769,900, all figures from the same 2024 Census estimates.
Schools
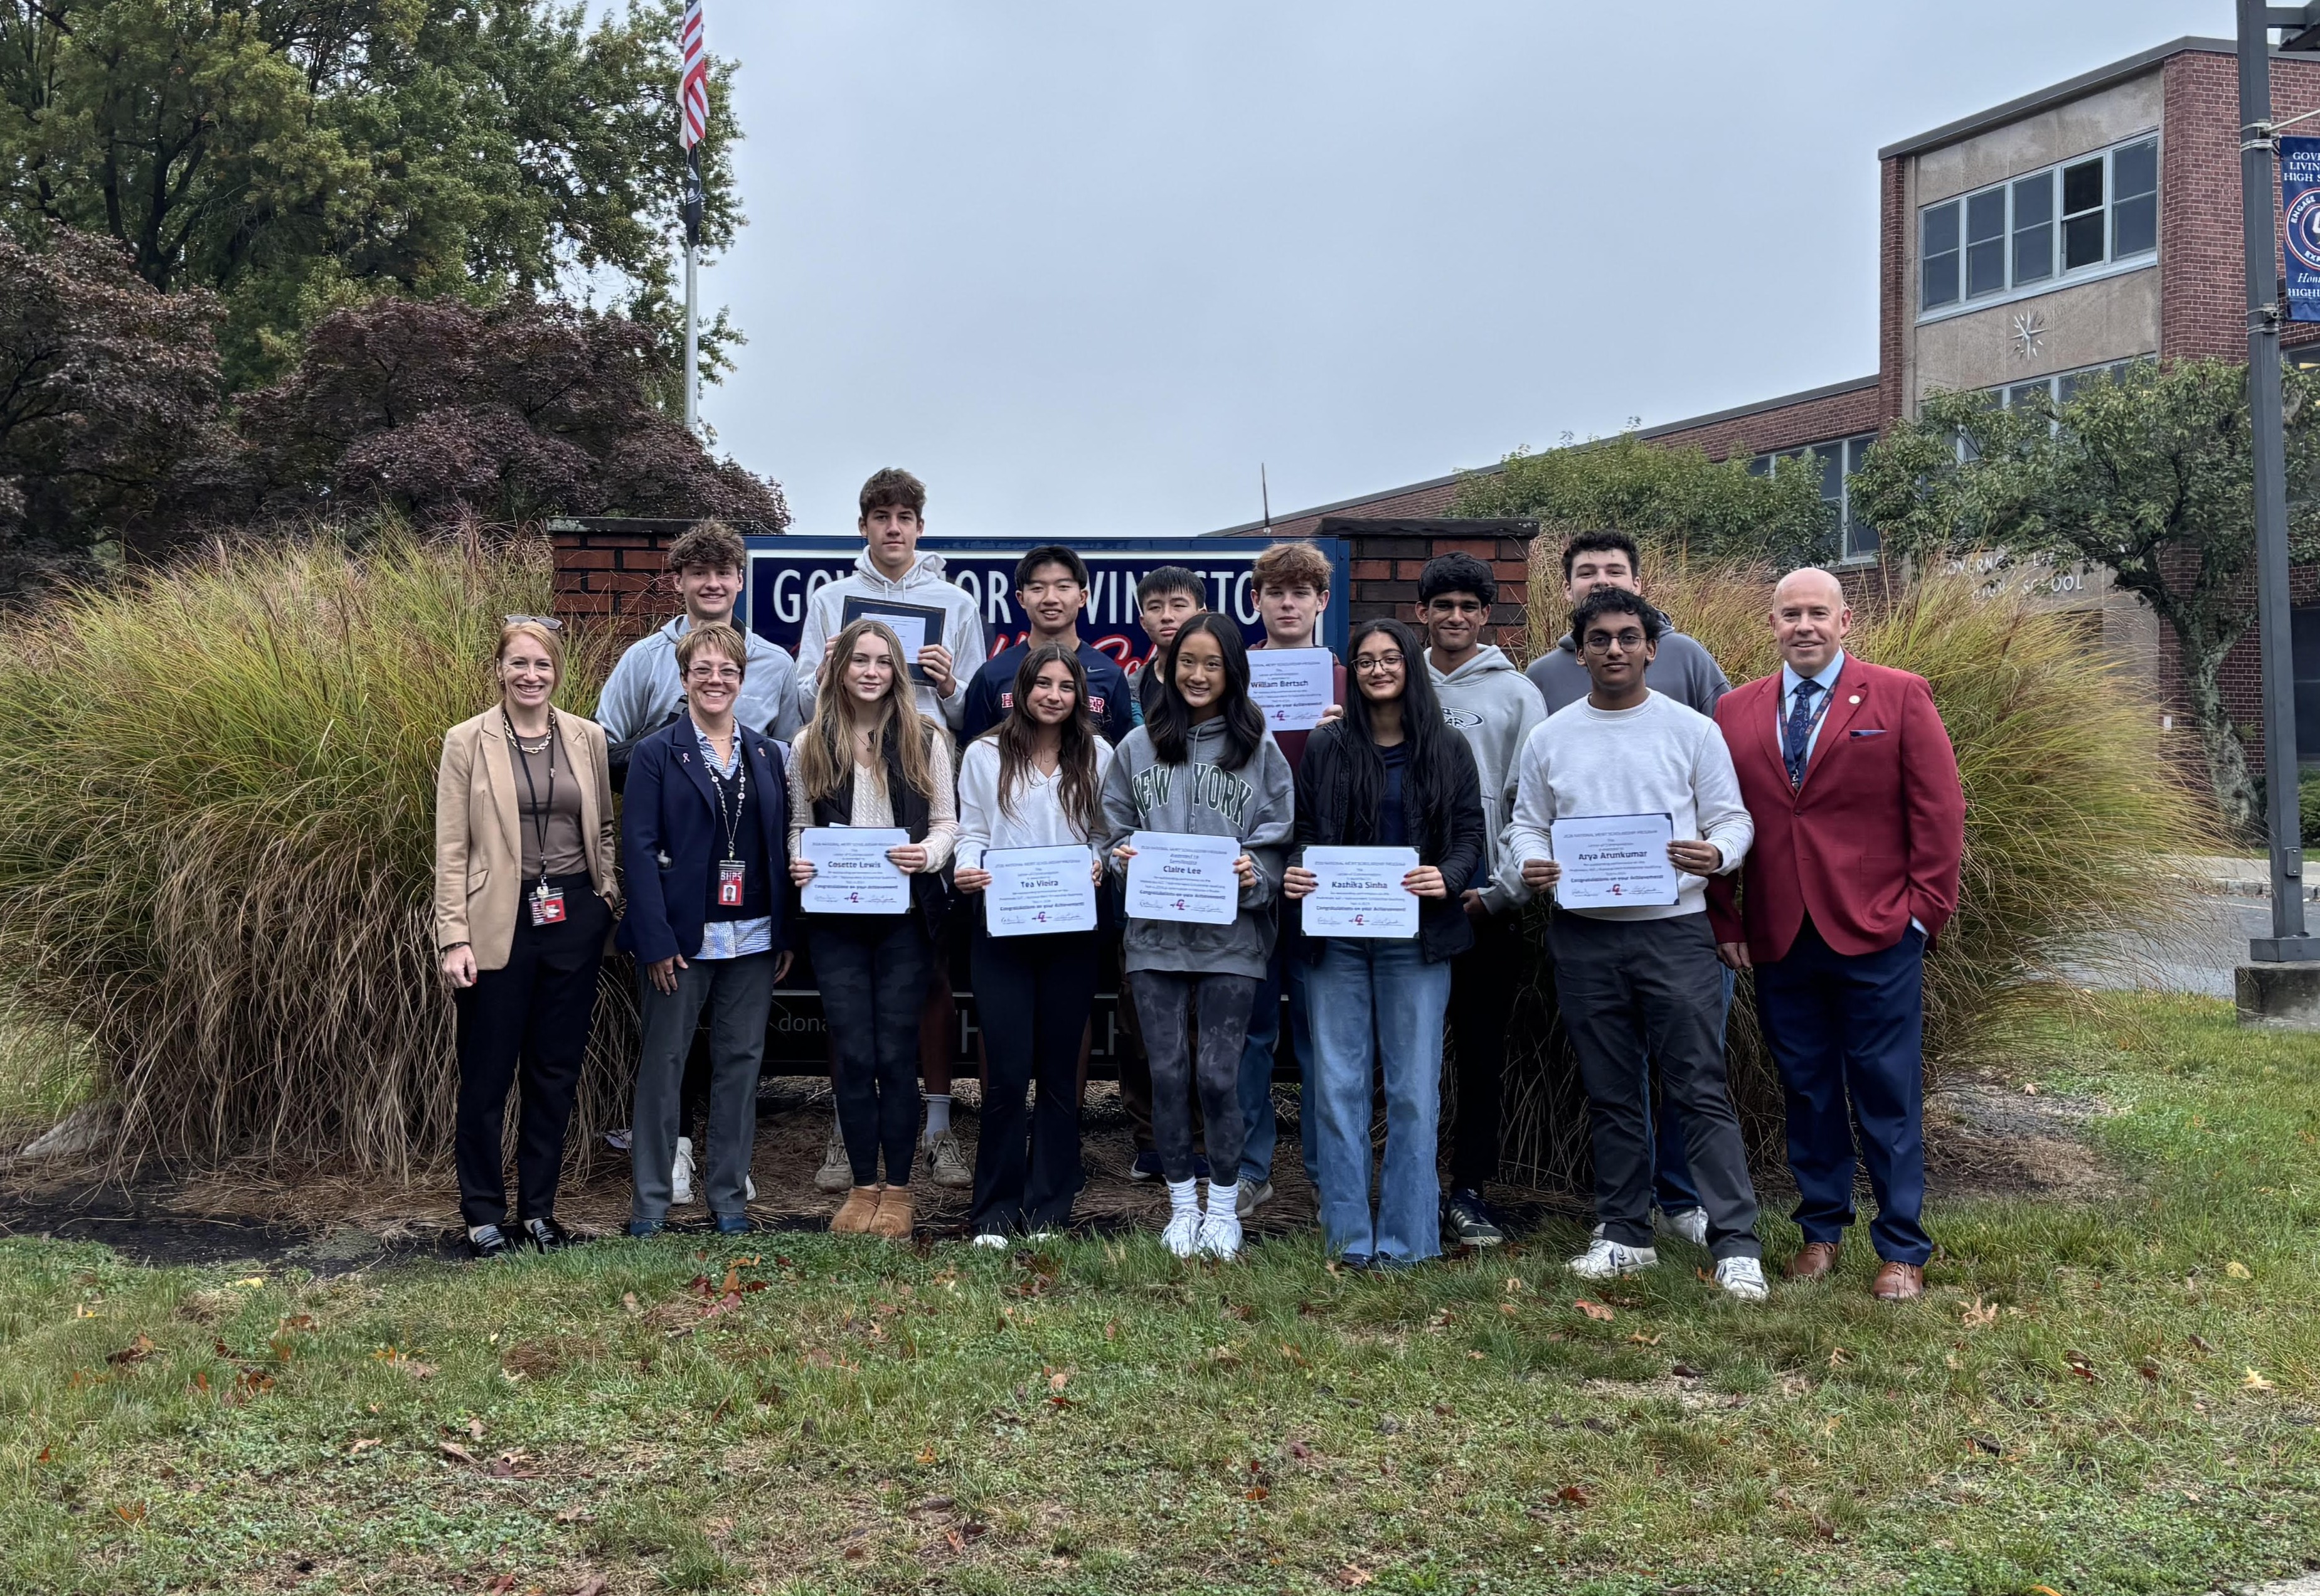
Governor Livingston High School enrolled 905 students in 2023-24. Its four-year graduation rate that year was 98.5% under the state calculation and 96.7% under the stricter federal calculation, against statewide averages of 91.3% and 87.7%, per the NJDOE School Performance Report for 2023-24. Math proficiency under federal accountability standards was 55.7%, against a 40.2% state average; English language arts proficiency was 81.4%, against 52.2% statewide. Chronic absenteeism was 7.2%, less than half the 14.9% state rate.
On college-entrance testing, the school’s average SAT score was 602 on reading and writing and 587 on math, against state averages of 530 and 519. Of 897 AP exams taken in 2023-24, 740 scored a 3 or higher, an 82.5% pass rate. None of this data is a promise about any individual student’s experience; it describes one high school’s outcomes in one recent, officially reported year.
Who Berkeley Heights Fits, and Who It Doesn’t
Good Fit If
- You want a short, predictable commute with an occasional direct train and can tolerate a Summit transfer off-peak.
- You’re buying to stay for years. Slow turnover rewards long holds and penalizes anyone who needs to resell fast.
- School outcomes weigh heavily in your decision. A public high school posting graduation and proficiency numbers well above the state average matters more to you than nightlife or walkable retail density.
Think Twice If
- You need rental housing. Ownership dominates the stock, and rental options are a small slice of a small town.
- You’re budgeting near $600,000 to $700,000. Some older sources still quote that range; the real 2024 entry point runs closer to $789,400.
- You want Summit’s downtown density. Berkeley Heights is smaller and quieter by design.
Life in Town

Beyond the commute, Berkeley Heights runs one of the region’s older Italian-American festivals: the Feast of Our Lady of Mount Carmel, a five-day event each mid-July at Mt. Carmel Field on Springfield Avenue and River Road, with a morning procession, carnival rides, a walkable downtown near the train station, and a fireworks night that has charged around $15 at the gate. The tradition has run for more than 110 years.
What’s the town like day to day, beyond commuting?
Small-town paced: a walkable downtown near the train station, town parks including Columbia Park, and a long-running July street festival that draws residents back every year.
Quick Facts
| Metric | Berkeley Heights | Source, year |
|---|---|---|
| Population | 13,426 | Census Bureau ACS 2024 5-yr |
| Median household income | $204,658 | Census Bureau ACS 2024 5-yr |
| Median home value | $789,400 | Census Bureau ACS 2024 5-yr |
| Average commute | 36.8 min | Census Bureau ACS 2024 5-yr |
| Housing units | 4,905 | Census Bureau ACS 2024 5-yr |
| Owner-occupancy | ~95% | Union County planning profile, ACS 2012-2016 5-yr |
| HS 4-yr graduation rate | 98.5% state version / 96.7% federal version | NJDOE School Performance Report, 2023-24 |
The owner-occupancy figure above is the most recent one found in this search; no current-vintage update was located, and it’s listed as an open research task below.
Comments