
What Bedford Homes Cost Right Now

Bedford’s closed-sale median sat at $815,000 through October 2025. Listings tell a different, more current story: Movoto’s MLS-based tracker showed a $1.21 million median list price in March 2026, with homes moving in 17 days, a 55% drop in days-on-market from March 2025.
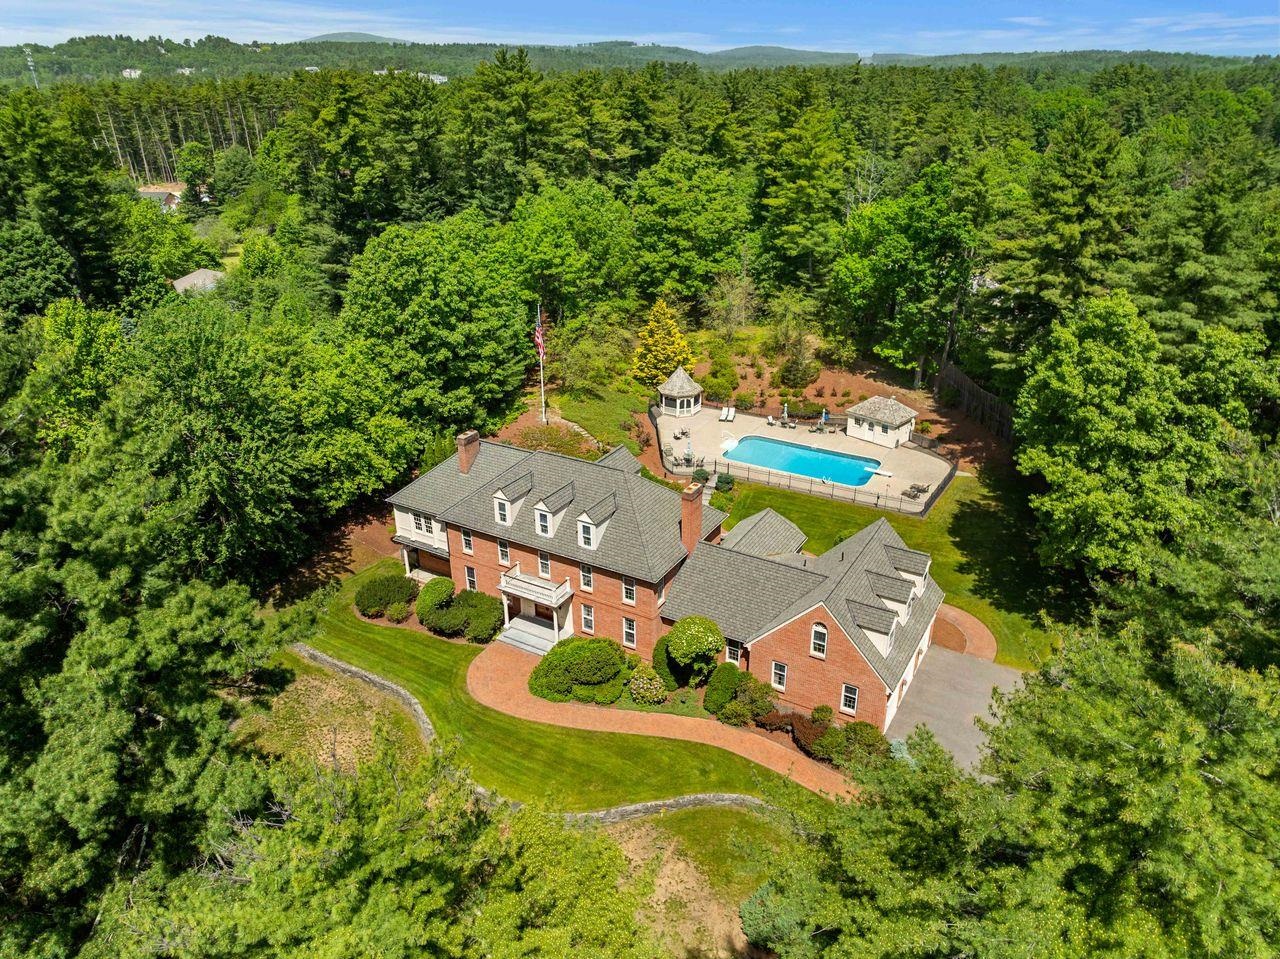
By June 2026 that median list price had eased to $872,000, at $302 per square foot, with a 10-day median time on market, per Movoto’s current listing data.
Four separate trackers have reported four different Bedford figures over the past year: Zillow’s home value index near $740,000 at the end of 2025, ATTOM’s mid-2025 median around $772,000 to $777,000, Rocket Homes at $857,500 in June 2025, and the $815,000 closed-sale median from NH Realtors covering the same general window. None of these are wrong. They measure different things: an automated valuation estimate, a closed-sale median, and a listing-price median, pulled at different months in a market where prices moved fast enough for the gap to matter.
Price signals for Bedford, NH
| Signal | Value | As-of date | What it measures | Source |
|---|---|---|---|---|
| Median closed sale (single-family) | $815,000 | Oct 2025 (YTD) | Actual recorded sale prices | NH Association of Realtors, via Union Leader |
| Median list price | $1.21M | Mar 2026 | Current asking prices, MLS-based | Movoto |
| Median list price | $872,000 | Jun 2026 | Current asking prices, MLS-based | Movoto |
| Price per square foot (listed) | $302 | Jun 2026 | Listing price divided by square footage | Movoto |
| Home value index | ≈$740,000 | Dec 2025 | Automated valuation model, not a sale price | Zillow, as reported by David Christensen Group |
A buyer comparing this table to a single number quoted elsewhere is comparing two different metrics. The closed-sale figure is the one to bring to a lender for a realistic monthly-payment estimate.
Property Taxes, Explained
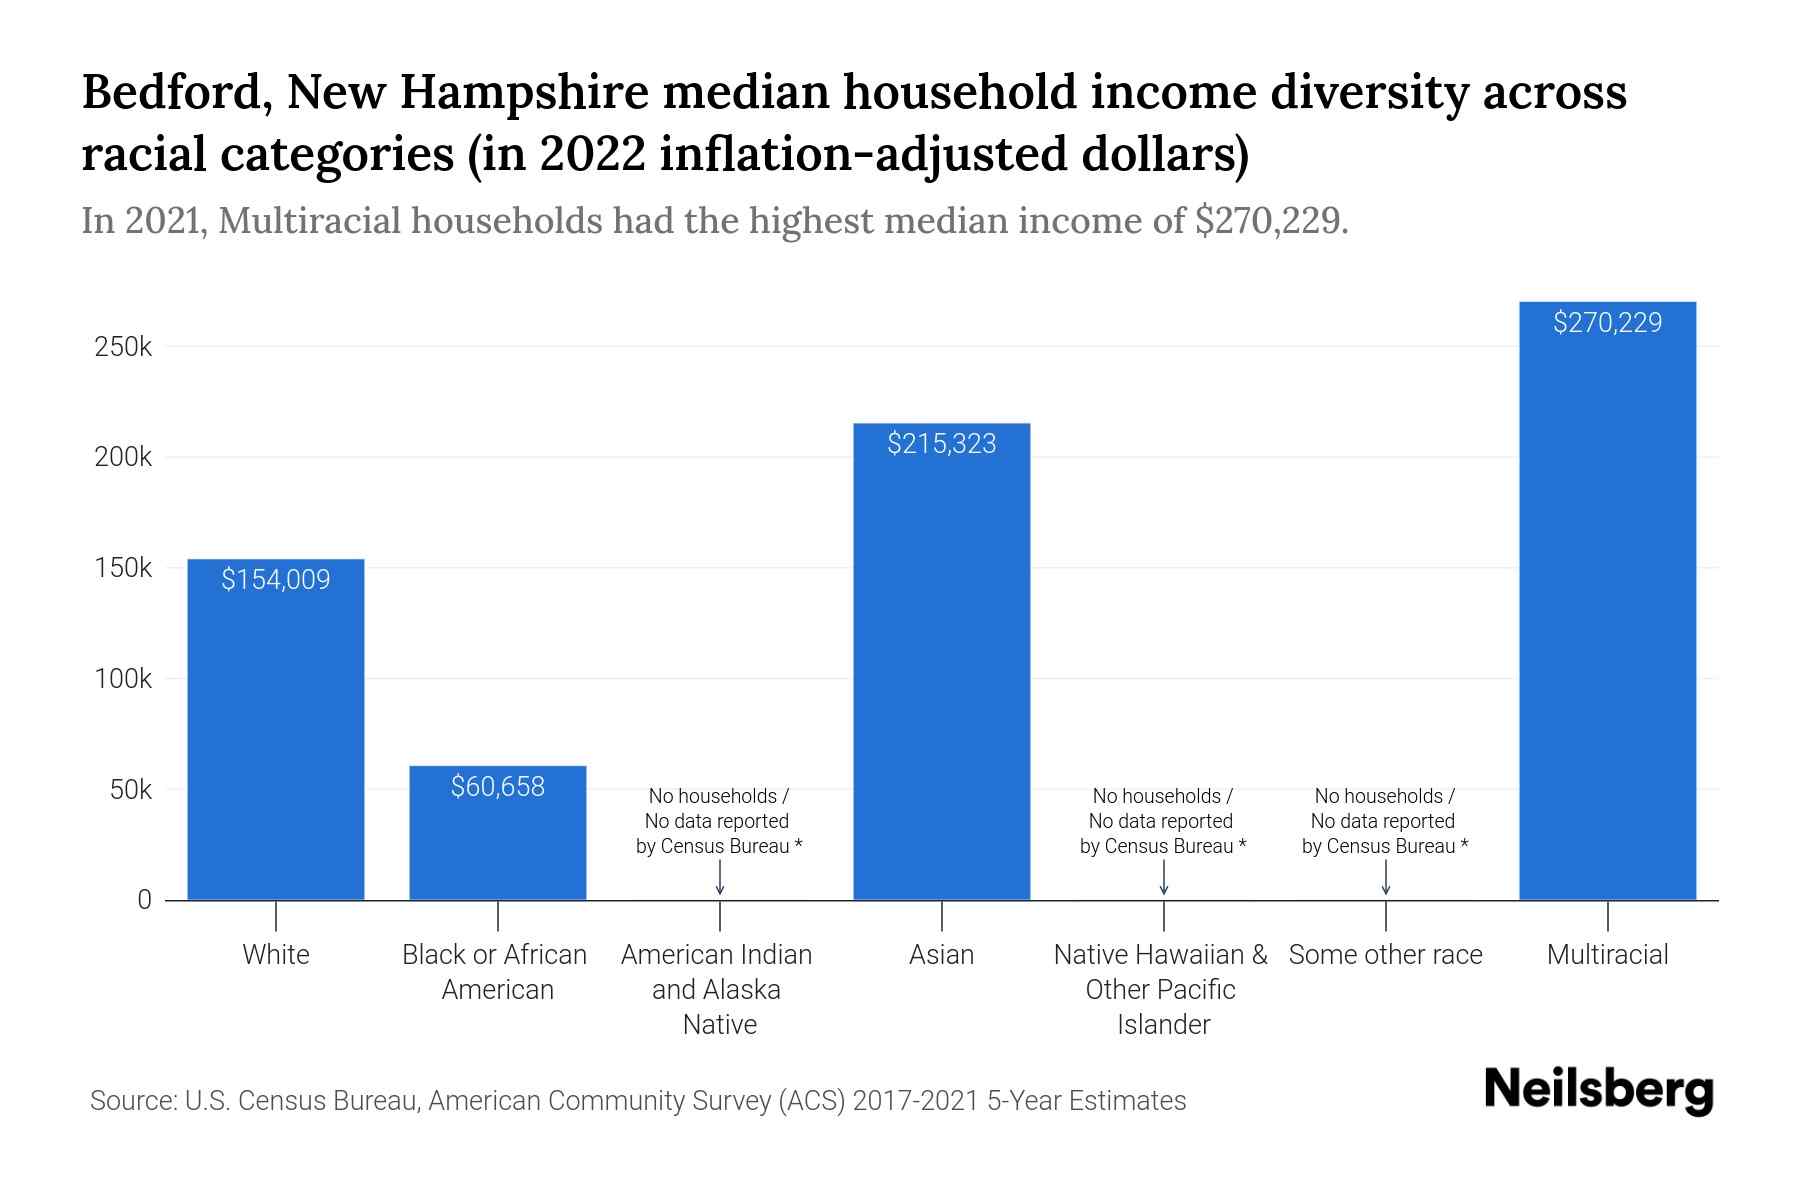
Bedford’s 2025 property tax rate is $16.49 per $1,000 of assessed value, set by the New Hampshire Department of Revenue Administration, up 68 cents (4.3%) from $15.81 in 2024. On a home assessed at $815,000, roughly matching the town’s own closed-sale median, that works out to about $13,440 a year. Of every tax dollar collected, about 70% funds the Bedford School District, 23.5% funds town operations, and 6.2% funds Hillsborough County.
That worked example is not abstract for Bedford’s own budget cycle: at a November 2025 Town Council meeting, councilors approved full-day kindergarten (about $365,000) and a $384,000 ambulance purchase for the fire department, additions that fed directly into the 2026 operating budget discussion.
Bedford’s rate looks favorable next to some neighbors and less favorable next to others. New Hampshire towns set rates independently each fall, so a straight comparison only works with the same tax year on both sides.
2025 property tax rates, southern New Hampshire
| Town | Rate per $1,000 (tax year) | Example bill on a $700,000 home | Source |
|---|---|---|---|
| Londonderry | $14.47 (2025) | $10,129 | Town of Londonderry |
| Bedford | $16.49 (2025) | $11,543 | NH DRA, via Union Leader |
| Derry | $18.99 (2025) | $13,293 | Eagle-Tribune |
| Manchester | $19.58 (2024 tax year) | $13,706 | NH DRA, via Union Leader |
| Merrimack | $22.11 (current bill) | $15,477 | Town of Merrimack |
Bedford sits closer to the low end of this set, though Londonderry currently runs lower. Manchester’s figure is a year older than the others here because that is the most recent confirmed DRA rate available; check the city’s own assessor page before relying on it for a 2025 comparison.
Is Bedford’s property tax rate that different from Manchester’s or Merrimack’s? On a $700,000 home, Bedford’s 2025 rate costs about $2,163 less per year than Manchester’s 2024 rate, and about $3,934 less than Merrimack’s current bill. Londonderry currently undercuts Bedford by about $1,414 a year on the same value.
Schools, School by School

Bedford’s public schools test well above the state average: district-wide math proficiency runs 74% against a 42% state average, and reading proficiency runs 77% against 51% statewide, according to New Hampshire Department of Education data compiled by Public School Review. But “top-rated district” hides real variation between the individual schools a family will actually be zoned into.
Bedford’s public schools, ranked
| School | Grade band | NH state standing | Enrollment (2024–25) | Notable proficiency data |
|---|---|---|---|---|
| Riddle Brook School | K–4 | 4th of 224 NH elementary schools | 502 | 86% math proficient (district 71%, state 42%) |
| Peter Woodbury School | K–4 | 3rd of 224 NH elementary schools | 428 | Top NH elementary school for female and special-education student subgroups in recent years |
| McKelvie Intermediate School | 4–5 | Not ranked this year (insufficient test-score data) | Not published | No current SchoolDigger proficiency ranking |
| Bedford High School | 9–12 | Top 8.1% of NH high schools | 1,398 | 86% reading proficient (state 55%); GreatSchools rating 8/10 |
Every Bedford student, regardless of which K–4 school they start in, moves through McKelvie for grades 4 and 5. That school currently carries no SchoolDigger ranking, a gap that does not show up in any “top-ranked district” summary and matters for a family assuming uniform quality across every grade. The district itself is commonly cited as 7th of 158 New Hampshire districts, though one SchoolDigger district-level page lists 11th of 163, a discrepancy likely tied to different snapshot years; treat the district rank as directionally strong rather than a fixed position.
Does McKelvie Intermediate carry the same standing as Bedford’s elementary schools? No. Peter Woodbury ranks 3rd and Riddle Brook ranks 4th of 224 New Hampshire elementary schools, but McKelvie, which every Bedford student attends for grades 4 and 5, is listed as not ranked this year due to insufficient test-score data.
Where in Bedford
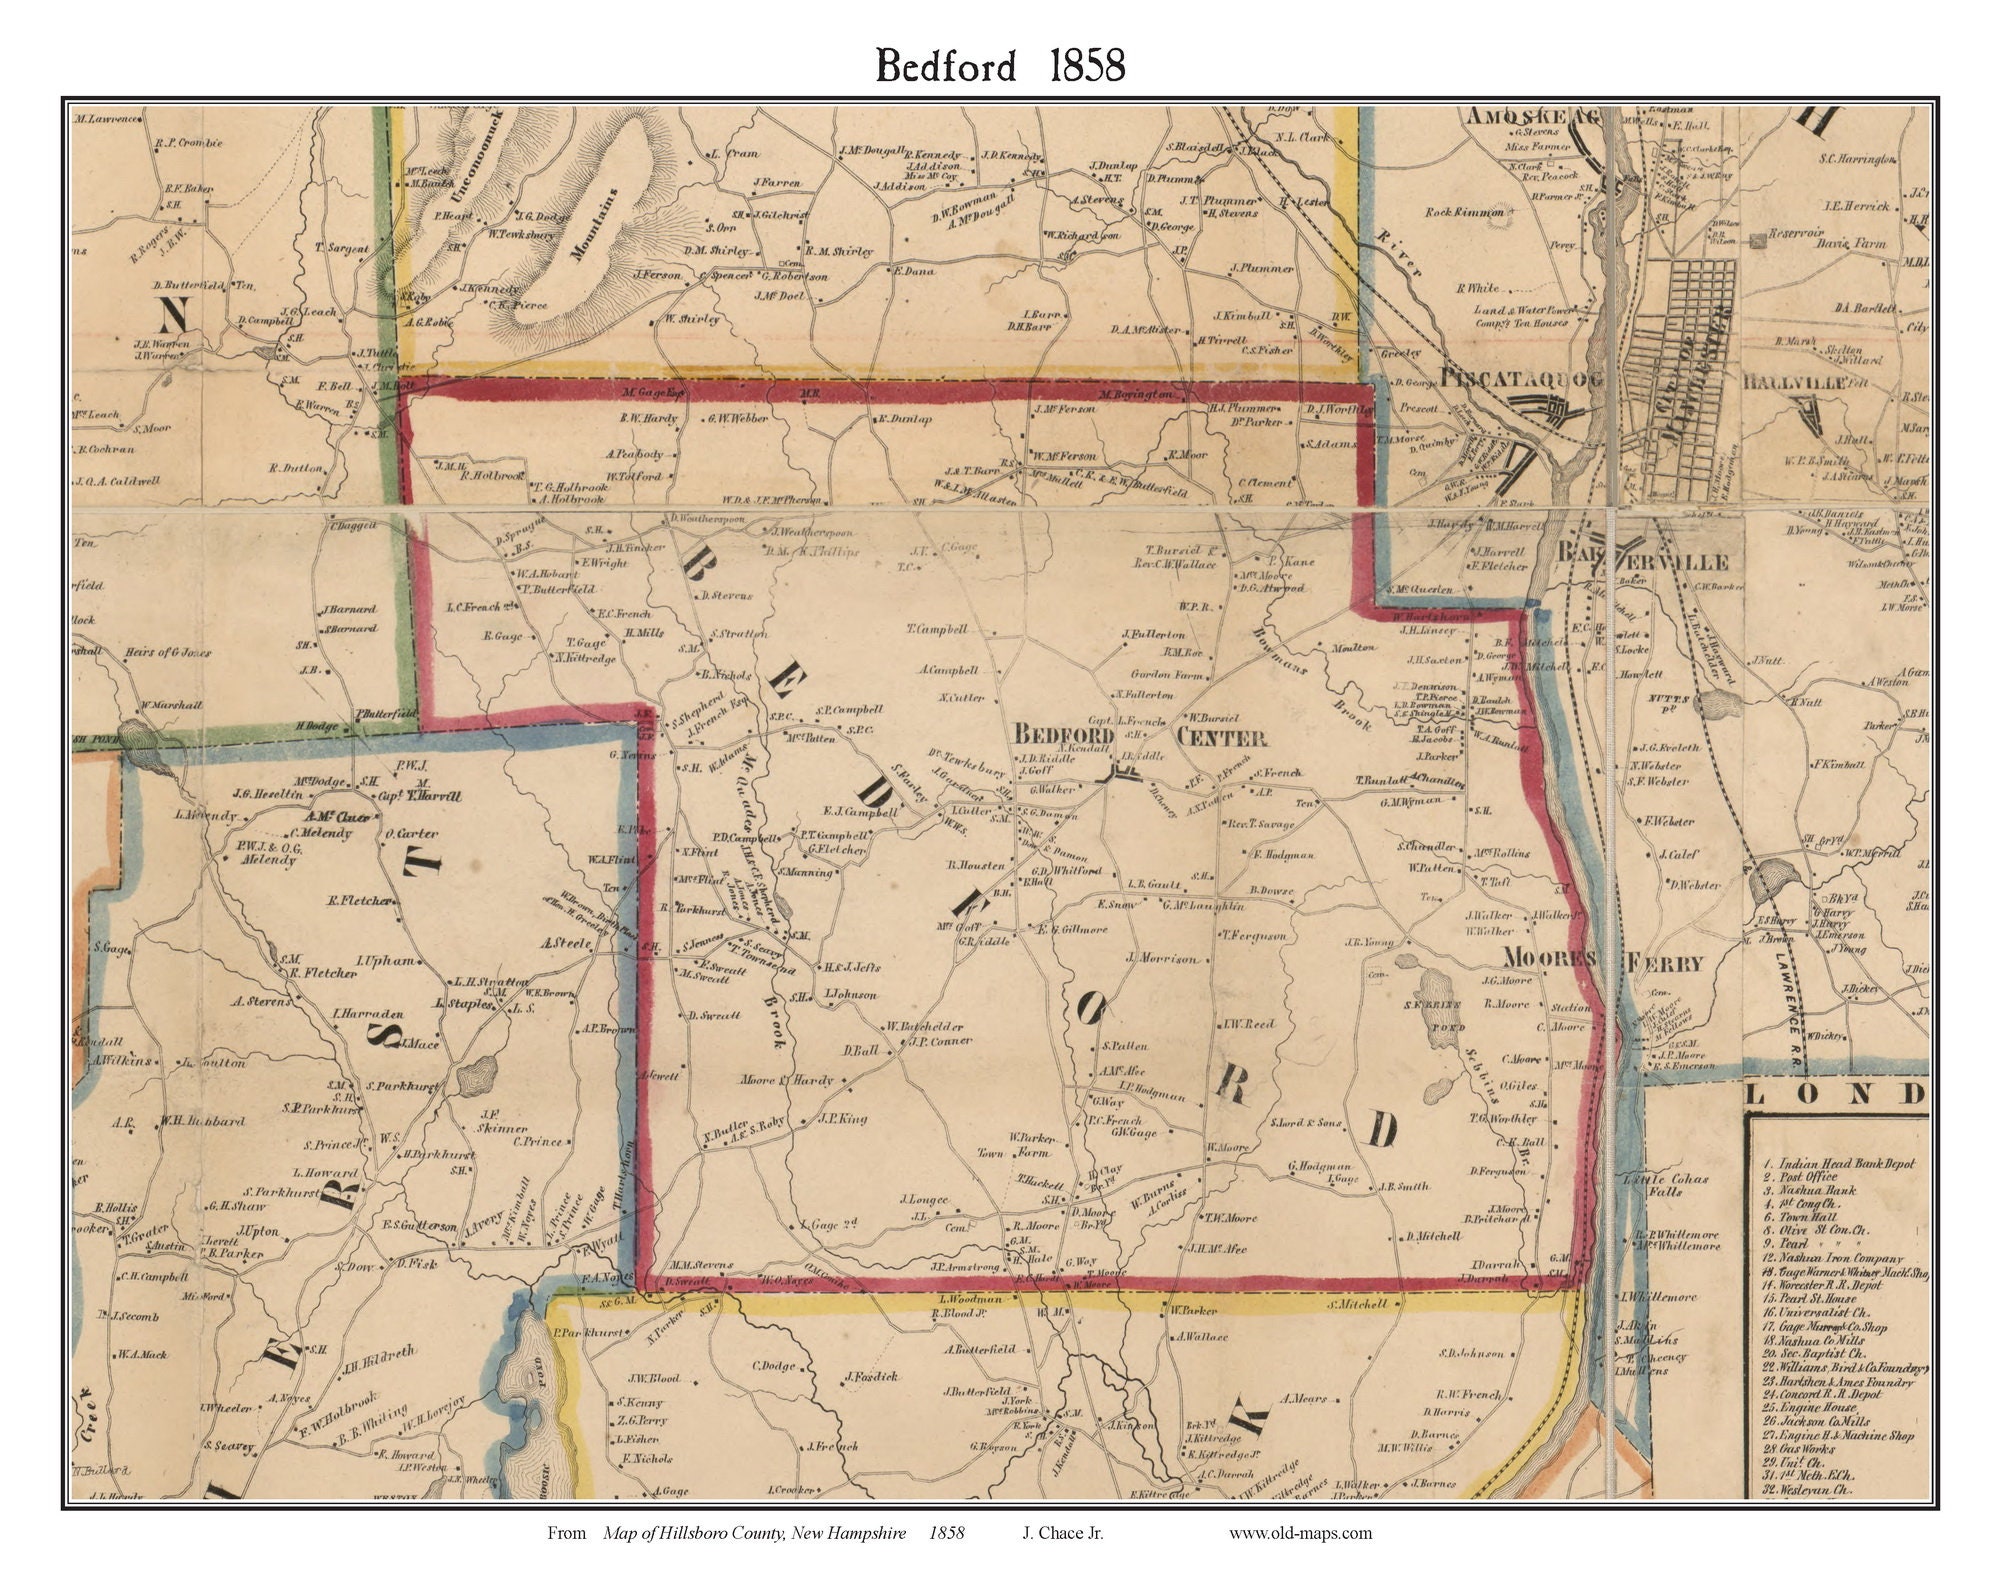
No public, independently verifiable source currently breaks Bedford’s home prices down by sub-area (historic center, the Route 101 corridor, or newer construction pockets). Local agents can speak to this from listing history, but that is practitioner knowledge, not published data. If location within town matters to your decision, ask any agent you work with to pull comparable sales by street or elementary-school zone directly from PrimeMLS rather than relying on a town-wide median.
Bedford’s Market Pace, for Buyers and Investors
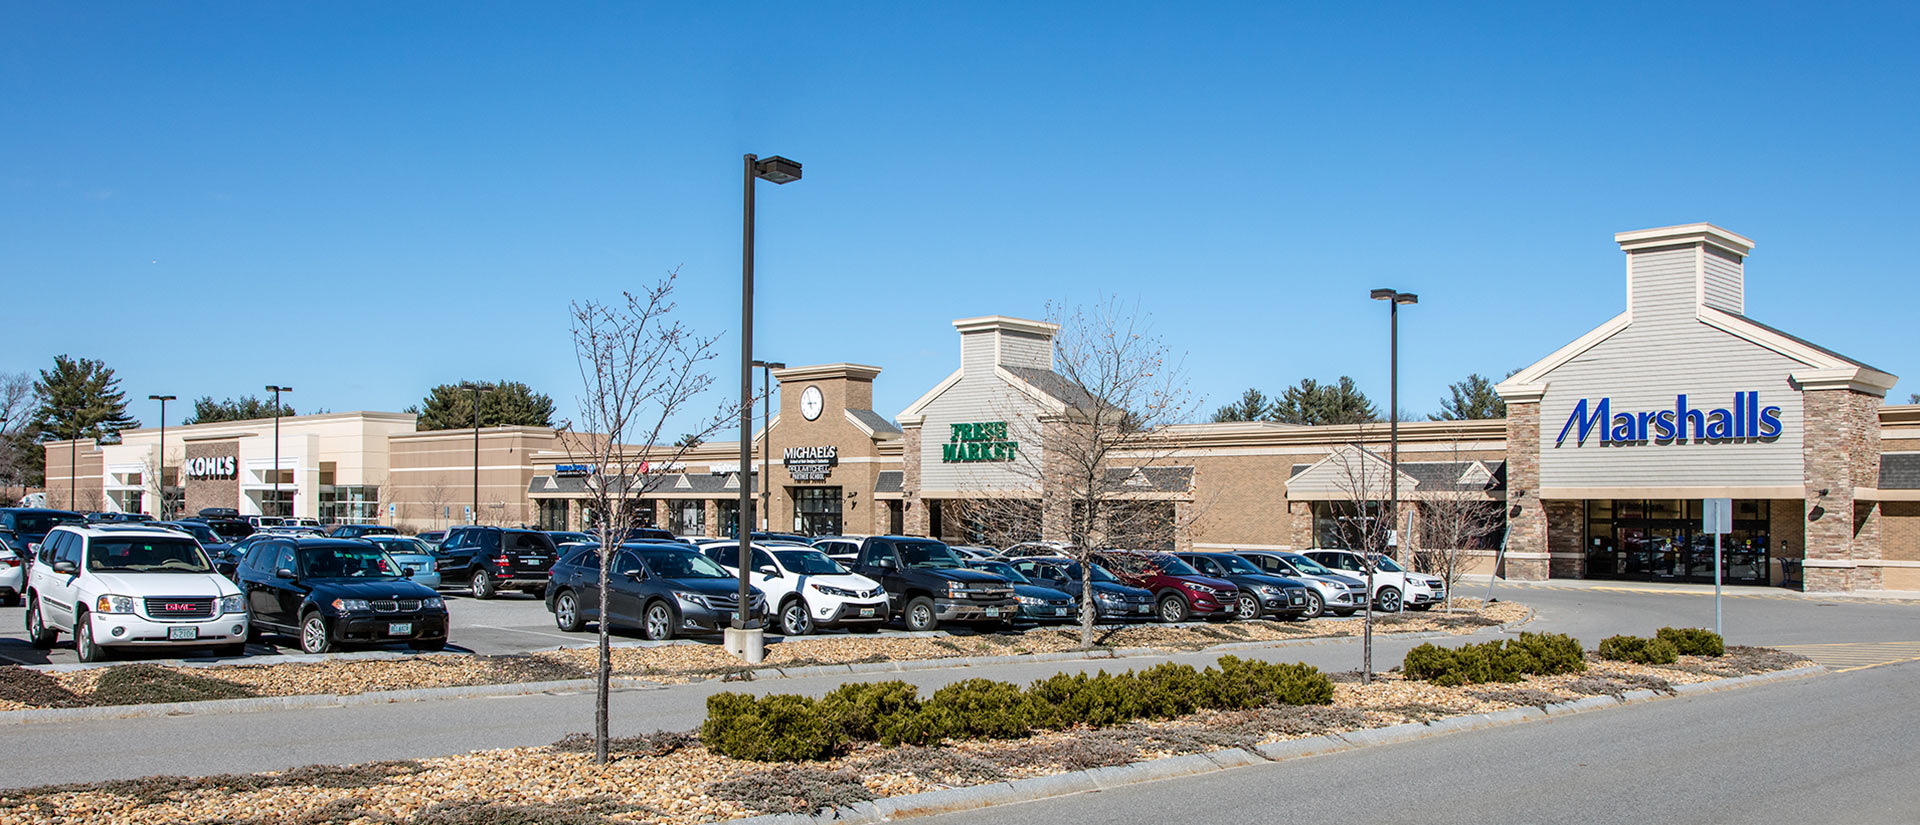
Bedford’s listing data shows a market that cooled between March and June 2026 without slowing down.
Bedford market pace, March vs. June 2026
| Metric | March 2026 | June 2026 | Source |
|---|---|---|---|
| Median list price | $1.21M | $872,000 | Movoto |
| Price per square foot | $357 | $302 | Movoto |
| Median days on market | 17 | 10 | Movoto |
Days-on-market fell even as the median list price dropped. Read together, the two figures suggest fewer high-end homes were in the June listing pool than in March, which would pull the median down on its own, while competition for whatever is listed stayed intense enough to keep homes moving in 10 days. That is an interpretation of the two data points above, not a separately confirmed fact. An investor weighing Bedford against a slower New Hampshire town should treat a 10-day median time on market as a live signal that underpriced or well-positioned listings get bid up quickly.
Is Bedford’s median home price $815,000 or over $1 million? Both figures are real, and neither is wrong. $815,000 is the closed-sale median through October 2025. Over $1 million was the median asking price in March 2026, a different metric taken seven months later, before the market cooled to an $872,000 asking median by June.
Rental yield, inventory absorption, and new-construction pipeline data for Bedford were not available from a source that met this page’s bar for verification during this pass.
For Sellers
- Price to the current asking market, not last year’s closed sales. June 2026’s $872,000 asking median sits well below March’s $1.21 million, so a listing priced off older comps risks sitting unsold.
- Expect a fast process if priced correctly. A 10-day median time on market in June 2026 means a well-priced, well-presented home is unlikely to need a second price cut.
- Budget for the transfer tax at closing. New Hampshire’s real estate transfer tax runs $0.75 per $100 of the sale price, owed by the seller separately from the buyer’s matching share, under RSA 78-B.
What will I pay in transfer tax when I sell in Bedford? New Hampshire charges $0.75 per $100 of the sale price to the seller and the same rate again to the buyer, a combined $1.50 per $100. On an $815,000 sale, that is roughly $6,113 from the seller’s side alone.
Buying From Out of State
- Line up financing before you start touring. With a 10- to 17-day median time on market through 2026, an unapproved buyer is competing against pre-approved ones on every showing.
- Budget the transfer tax into your closing costs. The buyer’s share matches the seller’s: $0.75 per $100 of the purchase price under RSA 78-B, on top of standard lender and title costs.
- Confirm the school zone in writing before you make an offer, especially if a specific elementary school matters to your decision; boundaries are drawn by address, not by neighborhood name.
Common Mistakes and Limitations
- Treating any single price figure as “the” Bedford median. Closed-sale medians, listing medians, and automated value indices measure different things and can differ by hundreds of thousands of dollars in the same season.
- Assuming Manchester’s tax rate is current for this year’s comparison. The $19.58 figure used above is the most recently confirmed DRA rate at the time of writing, for the 2024 tax year; confirm the current year directly with the city assessor before budgeting off it.
- Assuming “top-rated district” means every school in it carries the same rating. McKelvie Intermediate currently has no SchoolDigger ranking, a fact that does not appear in most district-level summaries.
- Skipping local verification on sub-area pricing. No public dataset currently segments Bedford by neighborhood; a median across the whole town can obscure real differences street to street.
Comments