
Current Market Snapshot

West Frankfort’s single-family homes sold for an average of $127,371 over the past year, moving at roughly $81 per square foot, based on public sale records tracked by BuyOwner.com. Active inventory sat at 43 listed homes as of mid-May 2026 by that FSBO count and at 81 by a separate, MLS GRID-sourced count taken a week later, a spread that reflects which listings each platform’s feed includes rather than a real swing in supply. Over the trailing year, 287 West Frankfort properties changed hands, which confirms this is an active market even at a low price point. Days-on-market isn’t included in the table below; the figures available for it are the two conflicting numbers addressed in the callout that follows, and neither is reliable enough to present as a settled statistic.
| Metric | Current Value | What It Means |
|---|---|---|
| Average sold price, single-family (trailing 12 mo) | $127,371 | Roughly a third of the U.S. median home price; the low absolute price is this market’s defining trait |
| Average sold price per square foot | $81 | A rough construction-cost floor: a gut rehab rarely pencils out much above this |
| Active single-family listings, spring 2026 | 43 to 81, depending on source | The range is a coverage artifact, not a demand signal |
| Properties sold, trailing 12 months | 287 | A market this size selling nearly 300 homes a year is genuinely liquid |
Why do different sites show different median prices for West Frankfort? “Median” can mean list price or sale price, a ZIP-wide cut or a city-wide cut, and a 12-month window that resets on a different day each month. Ask an agent for closed MLS comps on the specific street instead of trusting a single platform’s headline number.
What Financing Requires Below $75,000
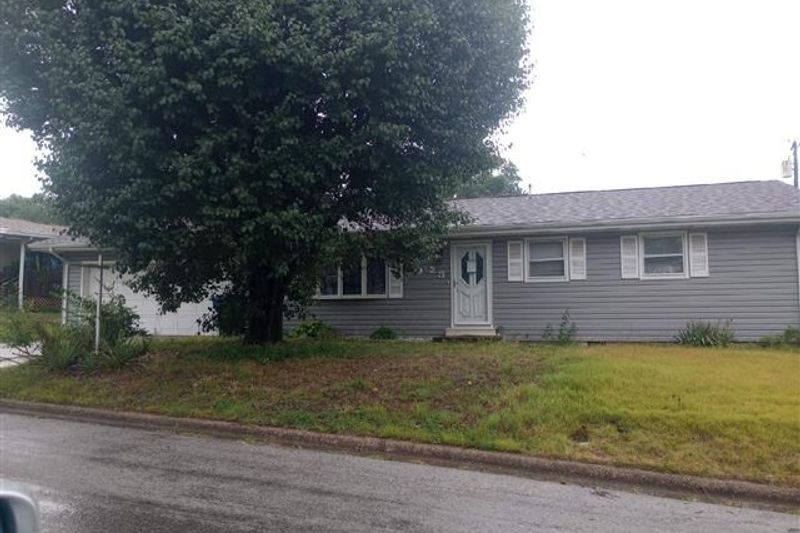
A home priced under roughly $50,000 in this ZIP often cannot be financed with a standard mortgage at all. Many lenders set a minimum loan amount, commonly $50,000 to $125,000, below which they decline to originate, because underwriting and servicing costs run several thousand dollars per loan regardless of its size. FHA, conventional, VA, and USDA programs themselves impose no such floor; the floor comes from the individual lender’s internal policy.
The gap is not unique to West Frankfort. Nationally, Urban Institute research compiled by the Local Housing Solutions project found that just over a quarter of homes sold for $70,000 or less were financed with a mortgage, compared with nearly four in five homes sold above that price. A meaningful share of West Frankfort’s inventory sits inside that $50,000 to $75,000 band, which places it in the cash-or-specialty-loan zone before a single showing happens.
| Price Band | Typical Financing Path | Key Consideration |
|---|---|---|
| Under $50,000 | Cash, hard money, or a local portfolio lender | Most national lenders decline to originate a loan this small, regardless of the borrower’s credit |
| $50,000 to $75,000 | FHA 203(k) rehab loan, portfolio lender, or a credit union willing to go below its posted minimum | Sits inside the band where national data shows most buyers pay cash |
| $75,000 to $150,000 | Standard FHA or conventional mortgage | Clears most lenders’ minimum thresholds; holds the bulk of West Frankfort’s sold inventory |
| Above $150,000 | Standard conventional mortgage | No minimum-loan friction |
The dividing line in this market has less to do with a home’s condition than with whether its price clears a lender’s internal minimum, a threshold that sits well below the average sale price for the ZIP.
Why can’t I get a conventional mortgage on a $50,000 house here? Origination and servicing costs run several thousand dollars regardless of loan size, so many lenders set a minimum, commonly $50,000 to $125,000, below which they won’t originate at all. An FHA 203(k) loan, a portfolio lender, or cash are the usual workarounds.
Buying “As-Is”: Distressed Inventory as a Market Signal
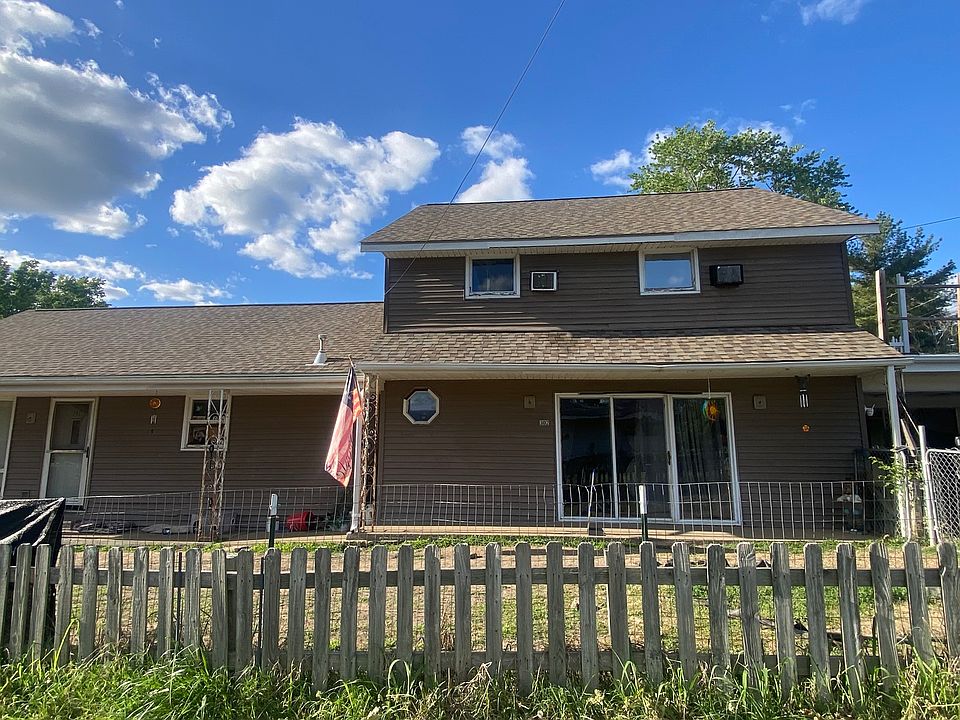
A meaningful share of West Frankfort’s active listings each season are marketed explicitly as “as-is,” sold without warranties, or framed for rehabbers and investors rather than move-in buyers. This is qualitative rather than a hard percentage: no county-level or MLS-tagged dataset breaking out the distressed share of this specific ZIP’s inventory turned up in this research, so treat the observation as directional, confirmed by browsing current listings, not as a sourced statistic. What that share implies is still concrete: a buyer shopping this ZIP by price alone, without separating move-in-ready stock from rehab stock, will end up comparing homes that aren’t actually substitutes for one another.
Signs a Listing Is Investor-Grade vs. Move-In Ready
- Explicit “as-is” or “no warranties” language in the listing description signals the seller expects no repair negotiation.
- Missing utilities at showing (no heat, no active electrical service) usually means the home won’t pass a standard appraisal until repaired, which itself complicates financing.
- A stated post-rehab value estimate in the listing copy is a seller signaling to investors specifically, not to owner-occupants.
- Recent full-system updates called out by name (new HVAC, new electrical panel, new roof) usually mark a move-in-ready listing aimed at owner-occupant buyers.
What a Former Coal-Mining Address Means for Insurance
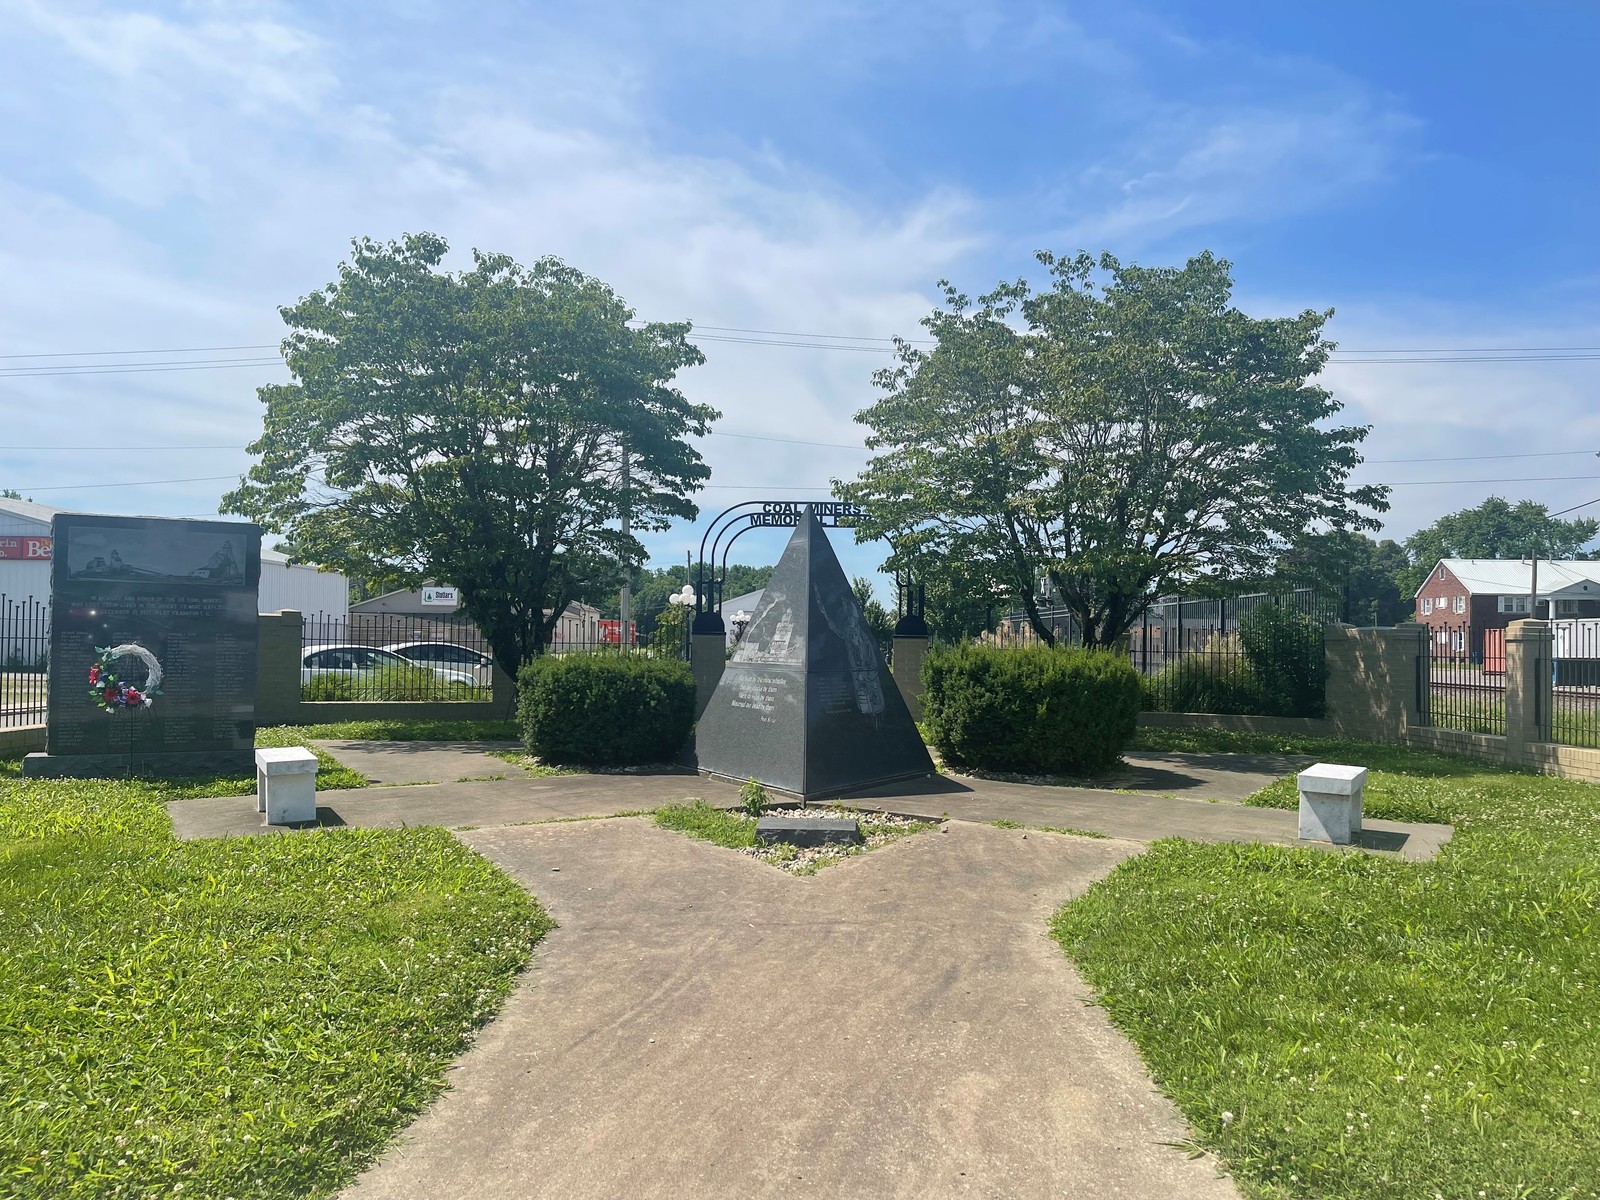
Franklin County is one of 34 Illinois counties where mine subsidence coverage is added to a homeowner’s policy automatically, up to $750,000 per structure, unless the buyer signs a written waiver. Illinois’ Mine Subsidence Disclosure Act and Residential Real Property Disclosure Act both require sellers to disclose known subsidence history at sale. On December 21, 1951, a methane explosion at the Orient No. 2 mine just outside town killed 119 miners, the disaster that led directly to the Illinois Mining Act of 1953; it’s a fact about the region’s mining scale, not a claim about any specific property’s subsidence risk today.
Do I need mine subsidence insurance to buy in West Frankfort? It’s added to your homeowner’s policy automatically because Franklin County is a mandatory-coverage county under Illinois law. You can waive it in writing, but most buyers in a former mining region choose to keep it.
Investing in 62896: Rental Demand and Cash Flow Basics
Average rent across all bedroom counts in West Frankfort runs about $800 a month, with two-bedroom units averaging $875 and ranging from $625 to $1,584, and three-bedroom units averaging $1,169. Set against an average purchase price of $127,371, that puts a fair amount of this market’s inventory within reach of a double-digit gross rent yield before taxes, insurance, vacancy, and repairs are subtracted.
Estimated Rent Ranges by Price Band
| Purchase Price Band | Typical Condition | Estimated Monthly Rent | Rough Gross Yield |
|---|---|---|---|
| $30,000 to $60,000 | As-is, needs rehab before renting | $700 to $950 | 14% to 19% (excludes rehab cost) |
| $60,000 to $100,000 | Light updates needed | $800 to $1,100 | 12% to 18% |
| $100,000 to $150,000 | Move-in ready | $950 to $1,400 | 9% to 13% |
| Above $150,000 | Larger or newer construction | $1,200 to $1,674 | 8% to 10% |
The yields at the low end of this table only hold up if the rehab cost gets added back into the basis; a $50,000 purchase that needs $30,000 of work is an $80,000 investment, not a $50,000 one.
Is West Frankfort a good rental market? The math favors cash-flow investors more than appreciation plays: rents are low in absolute dollars, but so are purchase prices, and the gap between the two produces gross yields well above what a $300,000-median-price metro can offer.
Lake Property vs. In-Town: Different Rules Apply
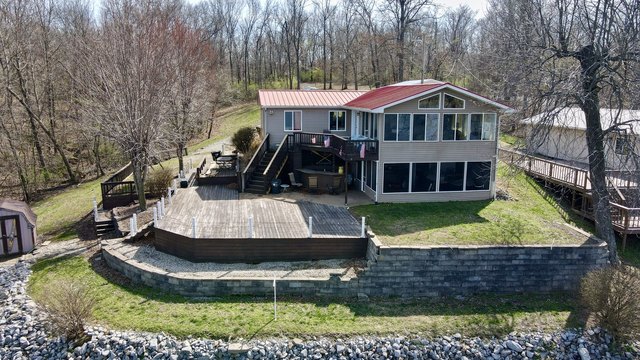
West Frankfort City Lake supports a small, low-inventory lakefront submarket distinct from the ZIP’s in-town housing stock; a two-bedroom lakefront listing marketed under the name “Shallow Waters Cottage” is a recent example of that submarket’s price and amenity profile. A property’s flood-zone status has to be checked parcel by parcel through FEMA’s Flood Map Service Center; no public dataset specific to West Frankfort surfaced in this research, so buyers considering a lake-adjacent property should treat that lookup as a required step, not an optional one, and should separately ask about dock permits and any lake-association rules before writing an offer.
Schools and Commute
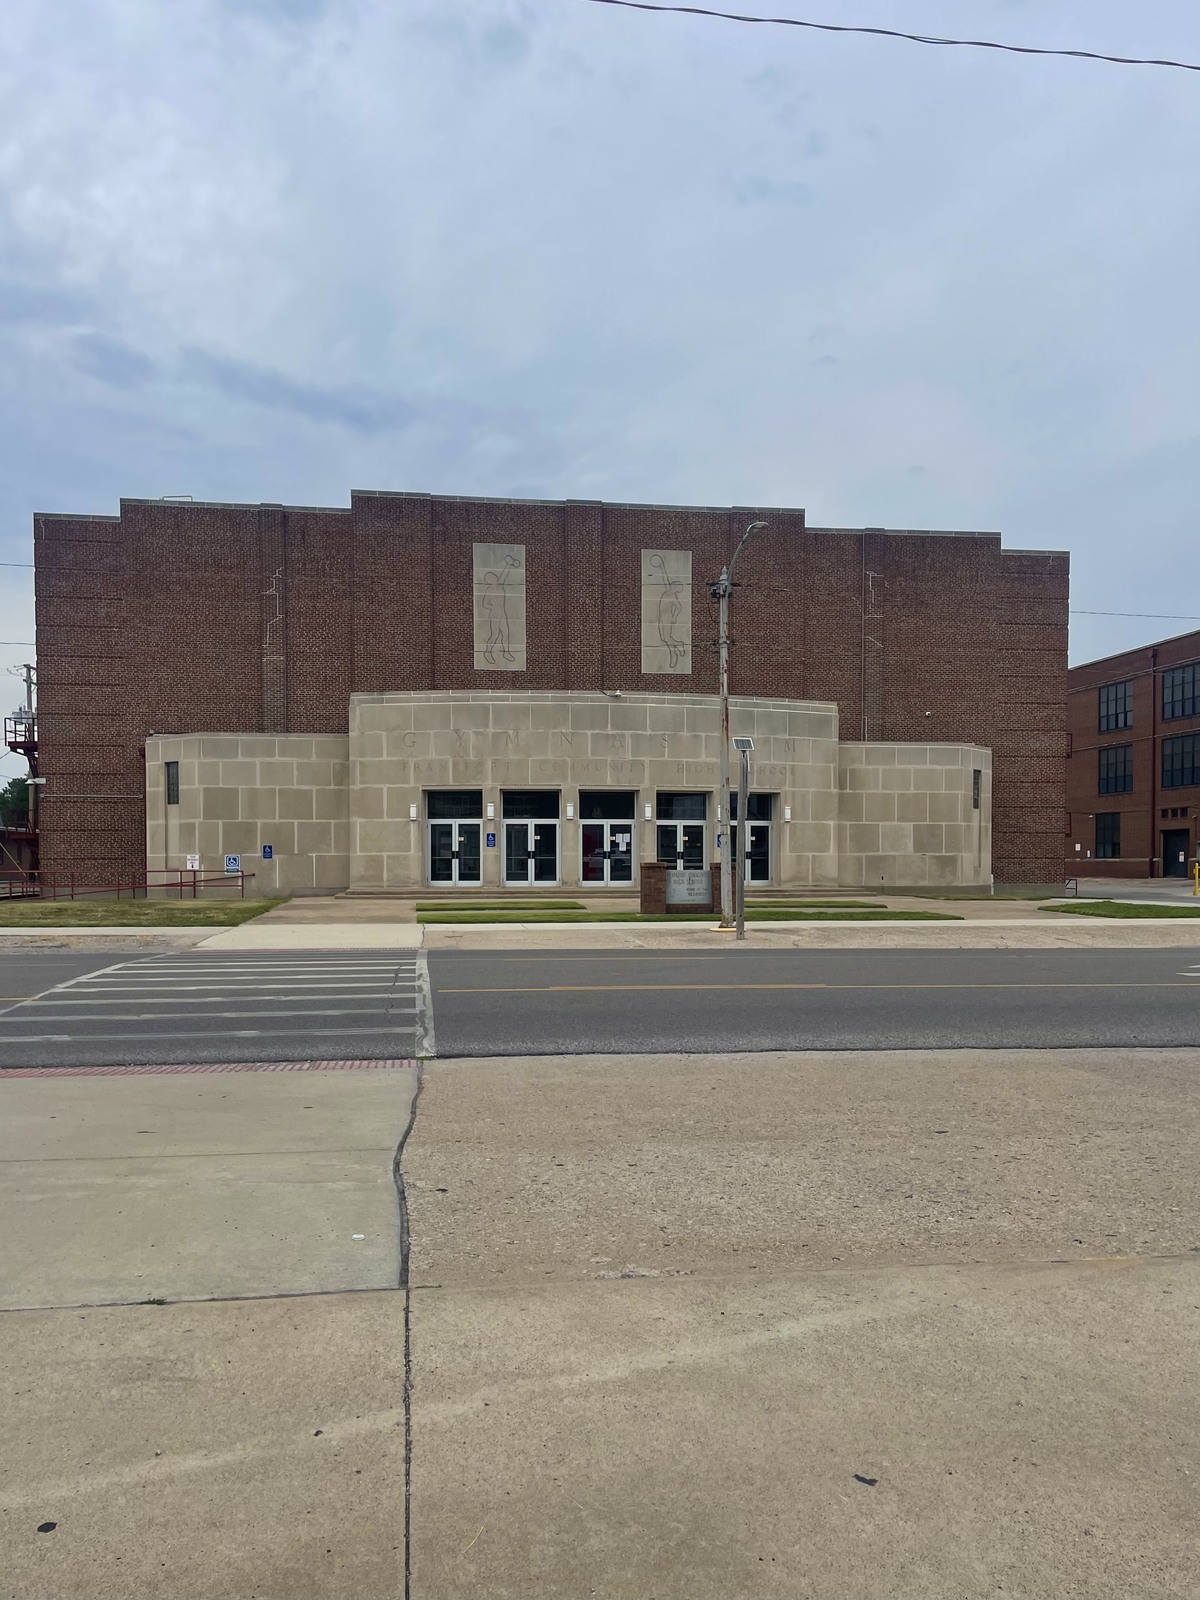
West Frankfort sits within Frankfort Community Unit School District 168. Frankfort Intermediate School carries a 4-out-of-10 GreatSchools rating, and Frankfort Community High School ranks 488th of 698 Illinois high schools, with 40.9% of 11th-graders proficient in ACT English against a 51.7% state average. Interstate 57 runs along the west side of town, connecting to Marion and Carbondale to the south.
Reading a Listing Price Against This Market
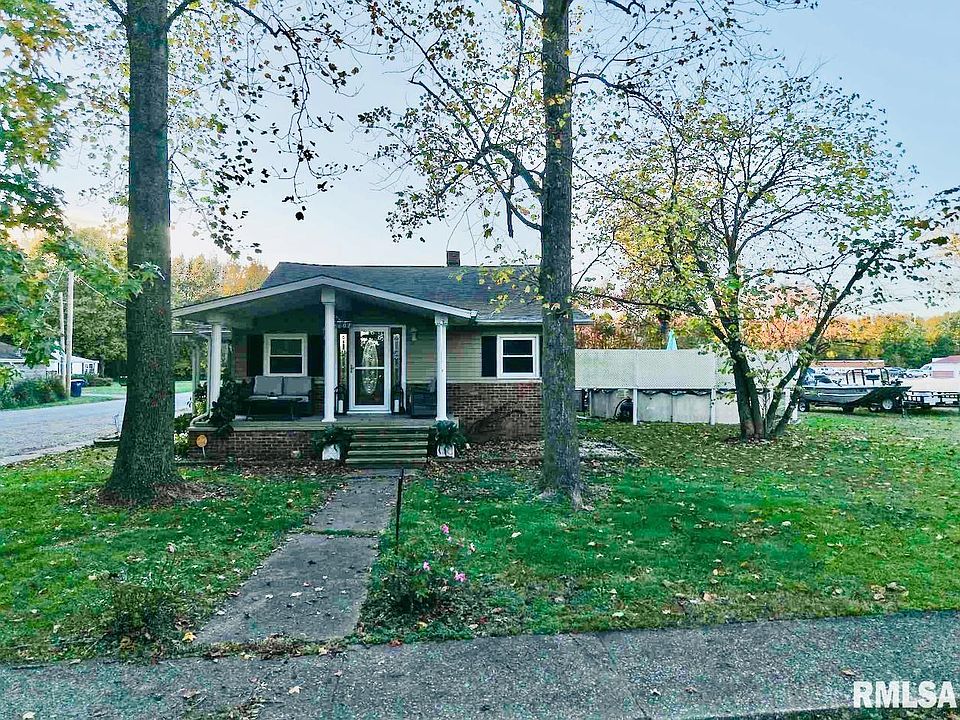
A $59,000 listing in this ZIP and a $145,000 listing in the same ZIP aren’t competing for the same buyer, and treating them as points on one continuous price curve is where most outside analysis of this market goes wrong. The first is a financing puzzle before it’s a housing decision; the second is a normal FHA or conventional purchase that clears every threshold discussed above without friction. Anyone comparing this ZIP against a metro-average price chart is, in effect, comparing two different markets stapled together under one name.
Comments