
Where Morgan Park Is, and Why the Numbers Depend on Whose Map You’re Using
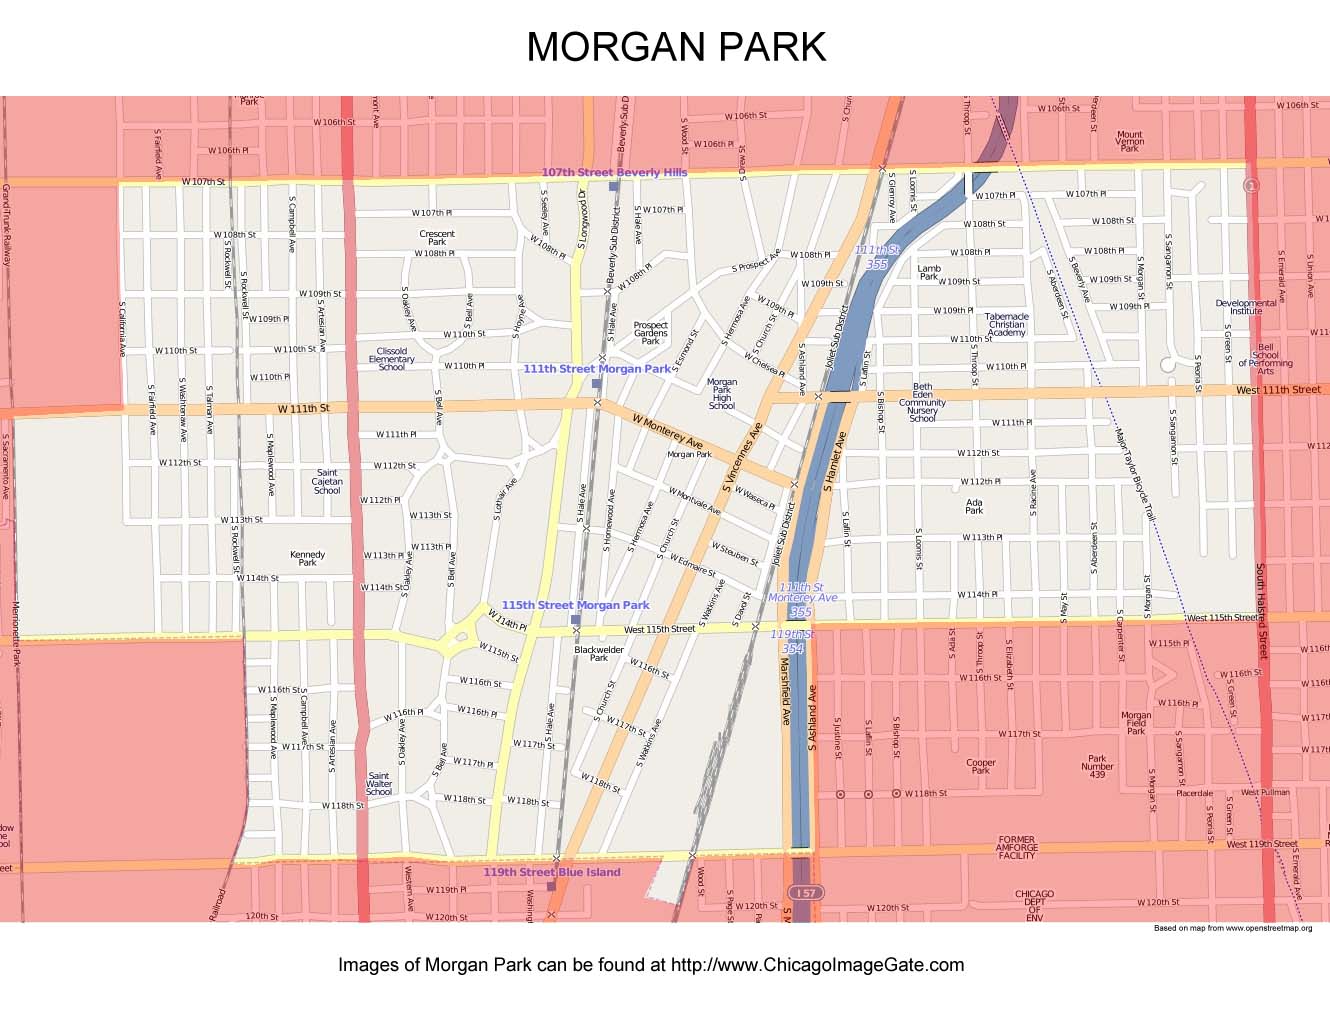
Morgan Park sits on Chicago’s far South Side, a short Metra ride from LaSalle Street Station downtown, within ZIP codes 60643 and 60655, shared with the neighboring community of Beverly. That shared ZIP code is the first source of confusion: real estate portals, census tools, and MLS neighborhood tags each draw the Morgan Park boundary a little differently, and a site pulling data from the wrong boundary reports a wrong-feeling price.
Beverly sits immediately west and north; the two names get used almost interchangeably in casual conversation and in some listing descriptions, even though they are separate, officially defined community areas with different price levels.
Is Morgan Park part of Beverly?No. They are adjacent, officially separate Chicago community areas that share a ZIP code, which is why some listings and articles blur the two. Morgan Park’s May 2026 median sale price runs about $110,000 below Beverly’s.
Home Prices: What Four Trackers Actually Show This Spring
| Metric | Morgan Park | Beverly | Chicago citywide |
|---|---|---|---|
| Median sale price | $285,904, +11.0% YoY, May 2026 | $395,000, −3.5% YoY, Feb. 2026 | $420,000, +6.3% YoY, 3 mo. ending May 2026 |
| Price per square foot | $196, −2% YoY, July 2026 | $234, up 1.1% YoY | $303, up 5.9% YoY |
| Median days on market | 34, July 2026 | 53 | 47 |
| Owner-occupied share | 69.8% | – | 45.5% |
| Median year built | 1953 | – | 1952 |
A buyer comparing Morgan Park against these two reference points is comparing a market where seven in ten homes are owner-occupied against a citywide figure below five in ten, on housing stock roughly the same age as the city average, at a price level closer to Chicago’s older bungalow belt than to Beverly’s historic-district pricing.
Redfin’s $285,904 is not the only number in circulation. Movoto’s July 2026 tracker lists a median of $252,000, down 15% year over year. Net Gain Realty’s 90-day MLS-sold report, updated January 25, 2026, put the figure at $280,000. PropertyUp’s monthly update showed $311,000 in April and $270,000 in May. None of these four sources is wrong; they measure different things: asking price versus closed price, a 90-day trailing window versus a 12-month one, and a boundary drawn slightly differently depending on the underlying MLS feed.
Why do price estimates for Morgan Park vary so much between sites?Mainly two reasons: some trackers report active list prices, others report closed sale prices, and those move differently month to month; and some draw the Morgan Park boundary to include or exclude adjacent blocks that other sites assign to Beverly or Washington Heights.
Housing Stock and What the 1953 Median Year Built Means for Buyers
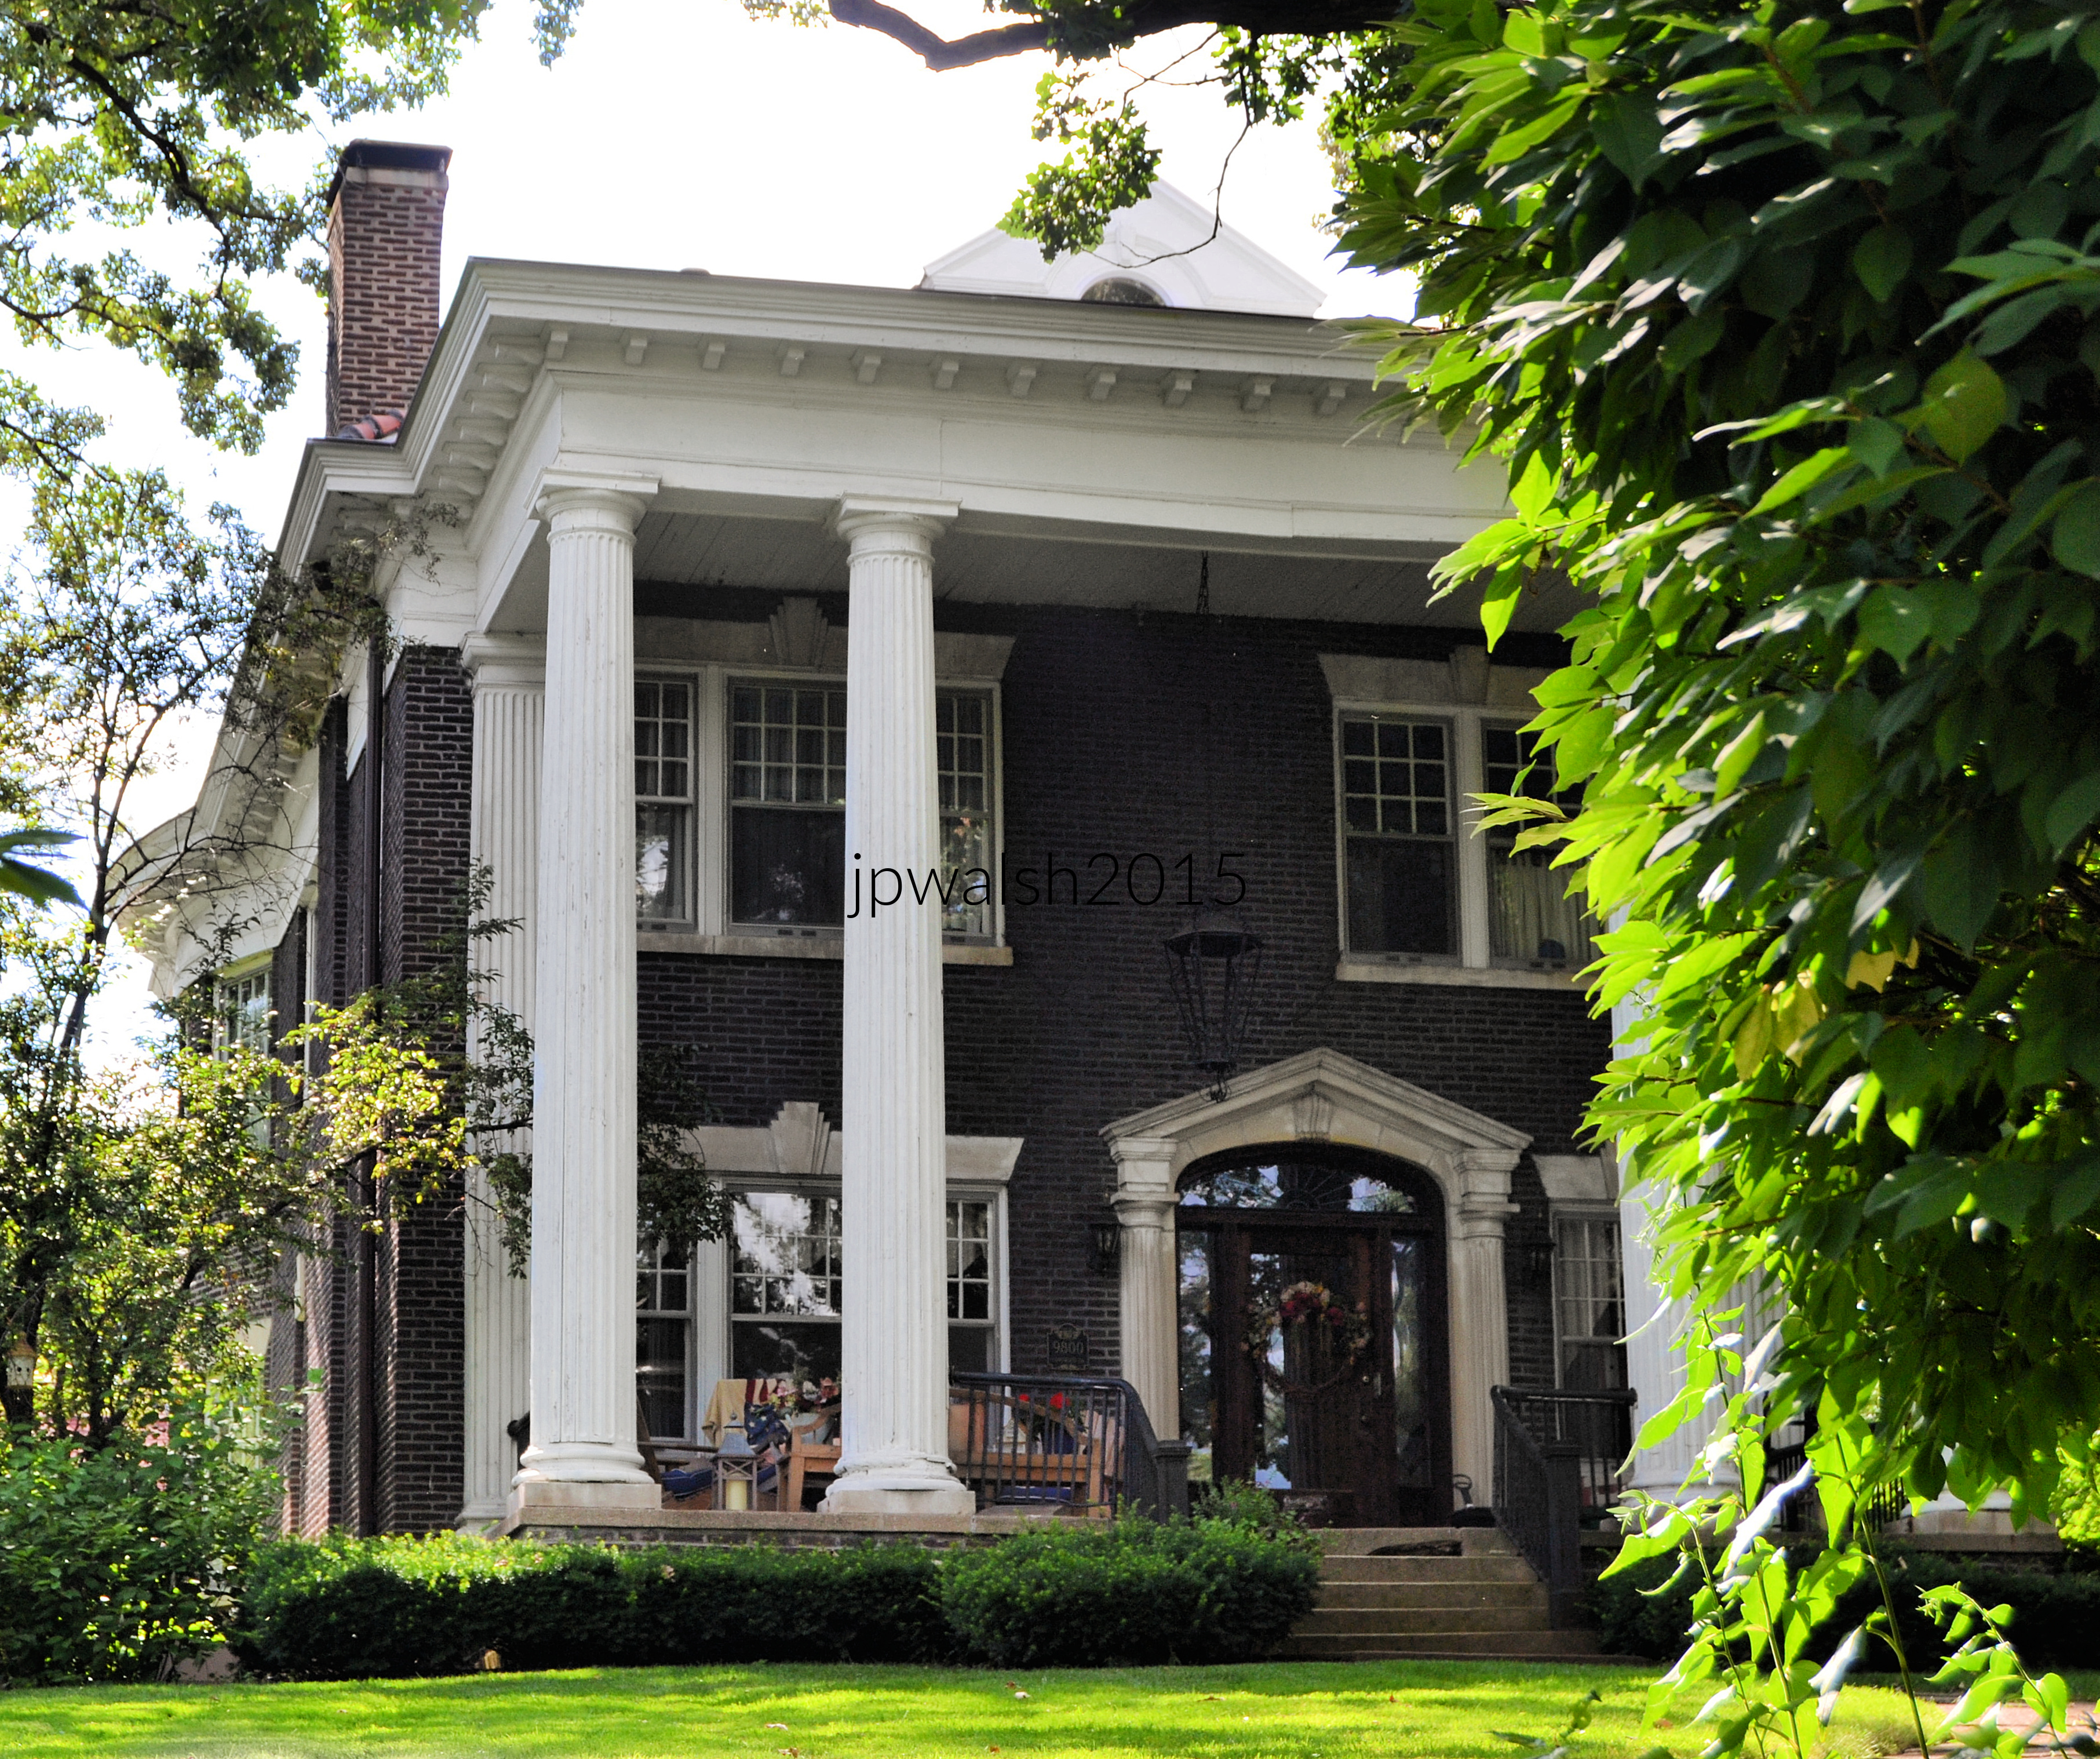
The typical Morgan Park home was built in 1953, and 54.4% of the housing stock dates to 1940–1969, according to CMAP’s most recent Community Data Snapshot. That vintage commonly carries knob-and-tube wiring remnants, galvanized supply plumbing, and lead-paint disclosure requirements a 1990s-built suburban home would not. A pre-offer inspection focused on electrical panel capacity and plumbing material is worth the cost here more than in a newer-construction market.
Safety, Block by Block, Not Neighborhood-Wide
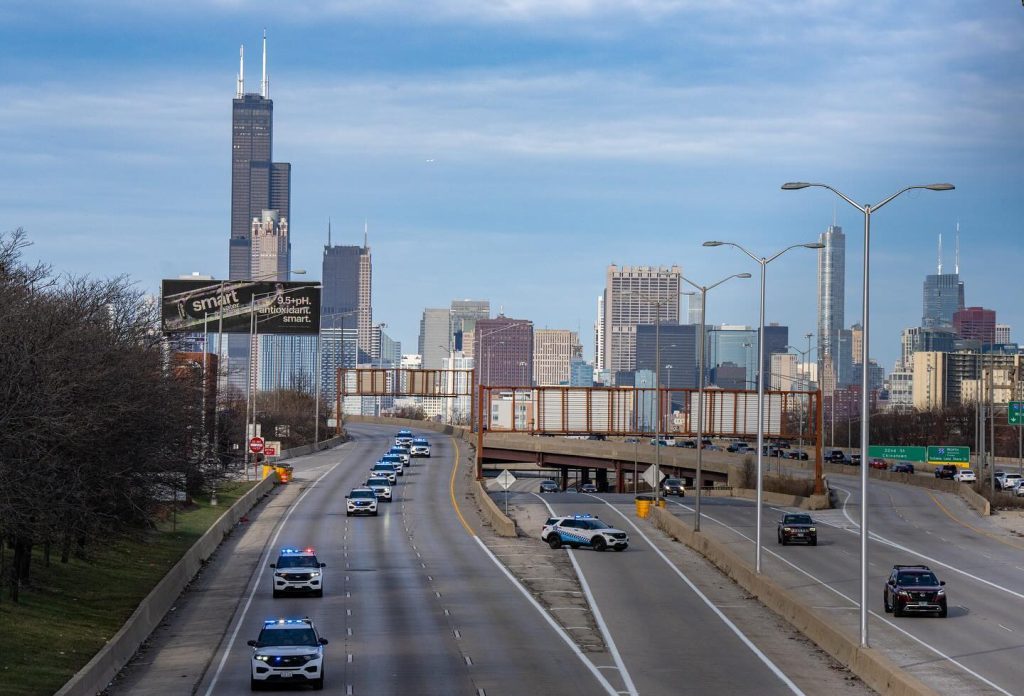
Morgan Park sits inside the Chicago Police Department’s 22nd District, which also covers Beverly, Mount Greenwood, Roseland, Auburn Gresham, and Washington Heights, so district-wide crime statistics blend Morgan Park with neighborhoods that have meaningfully different profiles. A private analytics firm, CrimeGrade, breaks Morgan Park itself into directional sub-areas using modeled, not government, incident data, and the pattern is directional rather than uniform.
| Sub-area | Safety signal (CrimeGrade, modeled, July 2026) | Price signal |
|---|---|---|
| West Morgan Park | Best per-capita odds in the neighborhood, about 1 in 44 | $329,000 median sale price, +19.6% YoY, Feb. 2026, per Redfin’s separately tracked sub-boundary |
| South Morgan Park | Worst per-capita odds, about 1 in 24 | Not separately tracked by Redfin |
| Northeast, near the retail corridor | Highest raw incident count, about 124 cases per year | Not separately tracked by Redfin |
| Southeast Morgan Park | Lowest raw incident count, about 28 cases per year | Not separately tracked by Redfin |
Two things matter for reading this table correctly. First, a modeled estimate from a private data vendor is not the same as a Chicago Police Department beat-level count; anyone weighing a specific block’s safety should cross-check against CPD’s own published data before relying on a vendor’s grade. Second, the northeast corridor’s higher raw incident count is partly an artifact of retail foot traffic rather than resident risk, since crime rates measured per capita undercount areas where few people live but many pass through. Of the neighborhood’s roughly 21,000 residents, relatively few live directly adjacent to that retail strip.
Is Morgan Park in Chicago safe?It depends on which part. CrimeGrade’s modeled data gives the neighborhood an overall B− grade and shows the west side with roughly double the safety odds of the south side. Cross-check any specific address against CPD’s own 22nd District data rather than relying on a single aggregate score.
Schools: Ratings, and What They Don’t Tell You
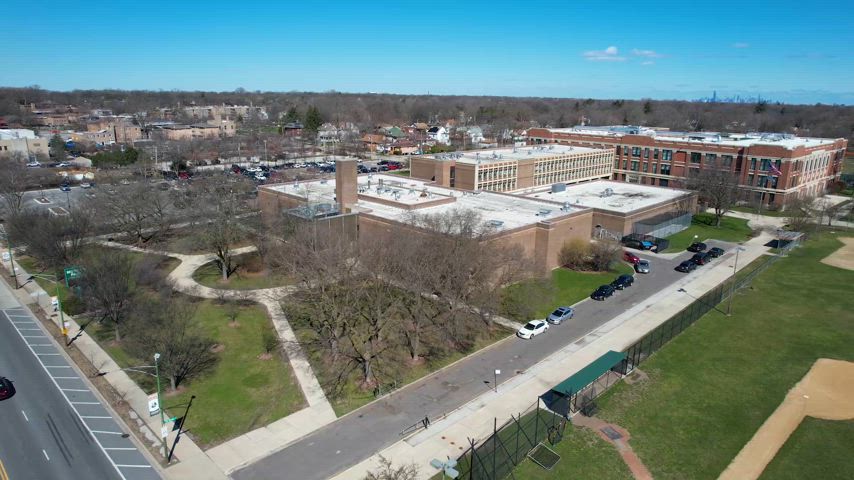
| School | Level | Public/private | Rating | Note |
|---|---|---|---|---|
| Morgan Park High School | 7–12 | CPS public | GreatSchools: performing below average vs. Illinois public and charter schools at the same grade levels | International Baccalaureate program |
| Esmond Elementary | K–8 | CPS public | Niche: C | |
| Clissold Elementary | K–8 | CPS public | Niche: B− | |
| Morgan Park Academy | PK–12 | Private | Niche: A+; top 20% of Illinois private schools | Founded 1873; 475 students |
One gap is worth naming rather than papering over: this page could not independently verify, through a government source, whether any Morgan Park sub-area falls outside the standard high-school attendance boundary into a different CPS zone. That claim appears in some secondary sources this page cannot cite as evidence, so it is left as an open item. Confirm any address’s exact attendance boundary directly with CPS’s Office of Planning and Data Management before assuming the neighborhood name guarantees a specific high school.
Getting to Downtown: The Metra Math
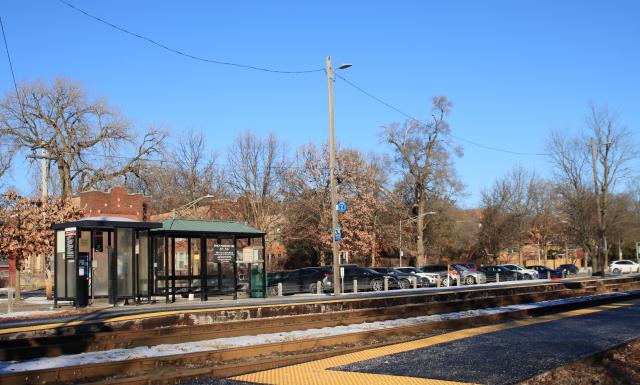
Two Metra stations sit inside Morgan Park, 111th Street–Morgan Park and 115th Street–Morgan Park, both on the Rock Island District’s Beverly Branch and both in fare Zone 2. A one-way Zone 1–2 ticket to LaSalle Street Station downtown costs $4.25 under the fare structure that took effect with Metra’s 2026 budget.
Service here changed meaningfully this year. On June 1, 2026, Metra expanded Rock Island Line weekday service from 80 to 84 trains and weekend service to 40 trains on both Saturday and Sunday, up from 33 and 29. That was labeled Phase 0.5 of a mandated regional-rail pilot; Phase 1.0, targeted for late 2026, is expected to separate Beverly Branch service from the mainline entirely and bring headways to 30 minutes or better within the city. Metra’s 2026 construction program lists a full renovation, including new platforms, parking areas, and lighting, at the 115th Street/Morgan Park station this year, with ADA and state-of-good-repair work at 111th Street/Morgan Park. For a buyer weighing a commute today against one a year from now, that is a genuinely different proposition than the fixed, static transit description most guides carry.
None of this is speculative. It is drawn from Metra’s own newsroom and its 2026 capital construction list, published this spring.
Renting Out or Buying to Hold: The Investor Numbers
| Metric | Value | What it suggests |
|---|---|---|
| Average 1-bedroom rent, Morgan Park | ~$1,500/mo, March 2026 | About 21% below the Chicago citywide average of ~$1,900 from the same source |
| Average 2-bedroom rent, Morgan Park | ~$1,850/mo, March 2026 | About 9% below the citywide ~$2,040 average |
| Median sale price to annual 1BR rent | $285,904 ÷ $18,000 ≈ 16 | A ratio near 15 to 20 generally favors renting for a household prioritizing lowest monthly cost; ratios below 15 typically favor buying |
| Chicago effective property tax rate | ~1.66% median | Below the Cook County-wide 2.14% median, though see the tax section below for a 2025 caveat |
Morgan Park’s rents sit below the citywide average by a wider margin on smaller units than on larger ones, which points toward stronger relative demand from families needing two- and three-bedroom space rather than from single renters, consistent with the neighborhood’s owner-occupied, single-family-detached housing mix.
Is Morgan Park a good area for rental investment?The numbers support it as a below-market-rent play more than a high-yield one. Average rents run meaningfully under the citywide figures, and the sale-to-rent math above suggests renting is currently cheaper than buying at listed prices, which cuts both ways depending on your holding period.
Property Taxes After a Reassessment Year
Chicago’s citywide median effective property tax rate runs around 1.66% of market value, below the Cook County median of 2.14%. That average understates what many South Side homeowners actually experienced in the most recent cycle. A Cook County Treasurer’s office study released in November 2025 found that median homeowner bills in 15 South and West Side neighborhoods rose an average of 30% following the 2024 Chicago reassessment, the largest jump in at least 30 years, with nine neighborhoods seeing bills rise more than 50%. The study attributes the shift partly to declining downtown commercial property values pushing more of the tax burden onto residential owners. A buyer budgeting off last year’s tax bill on a specific listing should confirm the current bill directly with the Cook County Treasurer.
Mistakes Buyers and Sellers Make Here

- Quoting a single site’s median price as “the” Morgan Park price. Four independent trackers spread across a 23% range in the same season; ask for actual comparable closed sales on the specific block instead.
- Assuming “Morgan Park schools” means one fixed set of options. Confirm the exact attendance boundary for a specific address directly with CPS rather than relying on the neighborhood name alone.
- Treating a neighborhood-wide crime score as block-specific. West and south Morgan Park show meaningfully different modeled safety odds; cross-check any address against CPD’s own district data.
- Budgeting property taxes off the prior owner’s bill. Reassessment-year jumps on the South Side have run well above the citywide average in recent cycles.
Comments