
What Merrick homes cost right now, and why every tracker disagrees
No two real estate data providers draw “Merrick” the same way, and the gap between them is large enough to change a listing strategy.
| Source | Geography | Metric | Value | Period |
|---|---|---|---|---|
| Redfin | Merrick city tracker | Median sale price | $863,000 (+6.2% YoY) | March 2026 |
| Redfin | Zip 11566 | Median sale price | $850,000 (+9.8% YoY) | December 2025 |
| Redfin | Merrick, all home types | Median sale price | $933,441 (+13.8% YoY) | May 2026 |
| Redfin | North Merrick | Median sale price | $905,000 (+11.8% YoY, 3-month avg) | April 2026 |
| Zillow ZHVI | Merrick | Home value index | $742,832 (+2.7% YoY) | 2026 |
| OneKey MLS, via Peter Raneri | Nassau County, single-family | Median closed sale | $890,000 (+9.9% YoY) | May 2026 |
The gap between Zillow’s $742,832 index and Redfin’s $933,441 figure isn’t a data error: ZHVI estimates the value of the entire existing housing stock, including homes that haven’t sold recently, while Redfin’s median tracks only what actually closed that month, which skews toward whichever price tier happened to transact. A buyer comparing “Merrick’s home value” across two sites is often comparing two different questions.
Is North Merrick the same market as Merrick? No. North Merrick is a distinct hamlet with its own Redfin tracker, its own school district, and a median sale price that has run $40,000 to $60,000 above the Merrick zip-code figure in recent months.
Merrick, North Merrick, and the zip code: three different geographies
Population figures for Merrick range from 21,744 to 22,040 depending on the source. Census Reporter‘s tract-level estimate and Point2Homes both cite 21,744. NeighborhoodScout‘s modeled figure is 22,040. Cosmo Group Realty, citing Census Bureau data directly, lands at roughly 21,800 to 21,816.
Current market conditions and what a competitive offer needs
Days on market for Merrick ranges from 29 (Movoto, July 2026 listings) to 40 to 44 (Redfin, sale-side data), and homes are selling for roughly 100% to 101.7% of list price. That’s a market where a clean, correctly priced listing still draws multiple looks, but it isn’t the six-day-close frenzy of 2021.
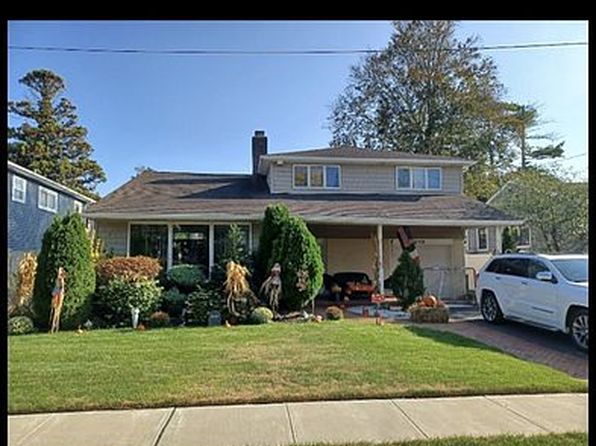
44 Keeler Ave, a 4-bedroom, 2-bath home listed at $850,000, closed at $925,000 on January 7, 2026 after 58 days on market, a 9% jump over asking. Two doors down in outcome terms, 985 Merrick Ave sat 257 days before closing at $1,070,000, 3% under its $1,099,000 list. Same zip code, same month range, opposite negotiating position: condition, price tier, and initial pricing discipline separated them.
What sellers should know right now
Overpricing to test demand is riskier in 2026 than it was two years ago, because buyers can see the same comparable-sales data a listing agent can. A home that sits past 60 days invites price-reduction assumptions even if it eventually sells at a fair number.
Is Merrick a buyer’s or seller’s market right now? Seller-favorable but not extreme: Redfin rates it “very competitive,” Nassau County inventory sits well below a balanced 4-to-6-month supply, and sale-to-list ratios above 100% are common, but days on market of 30 to 44 give buyers real time to inspect and negotiate compared with 2021’s sub-10-day closes.
The waterfront tradeoff nobody prices in up front
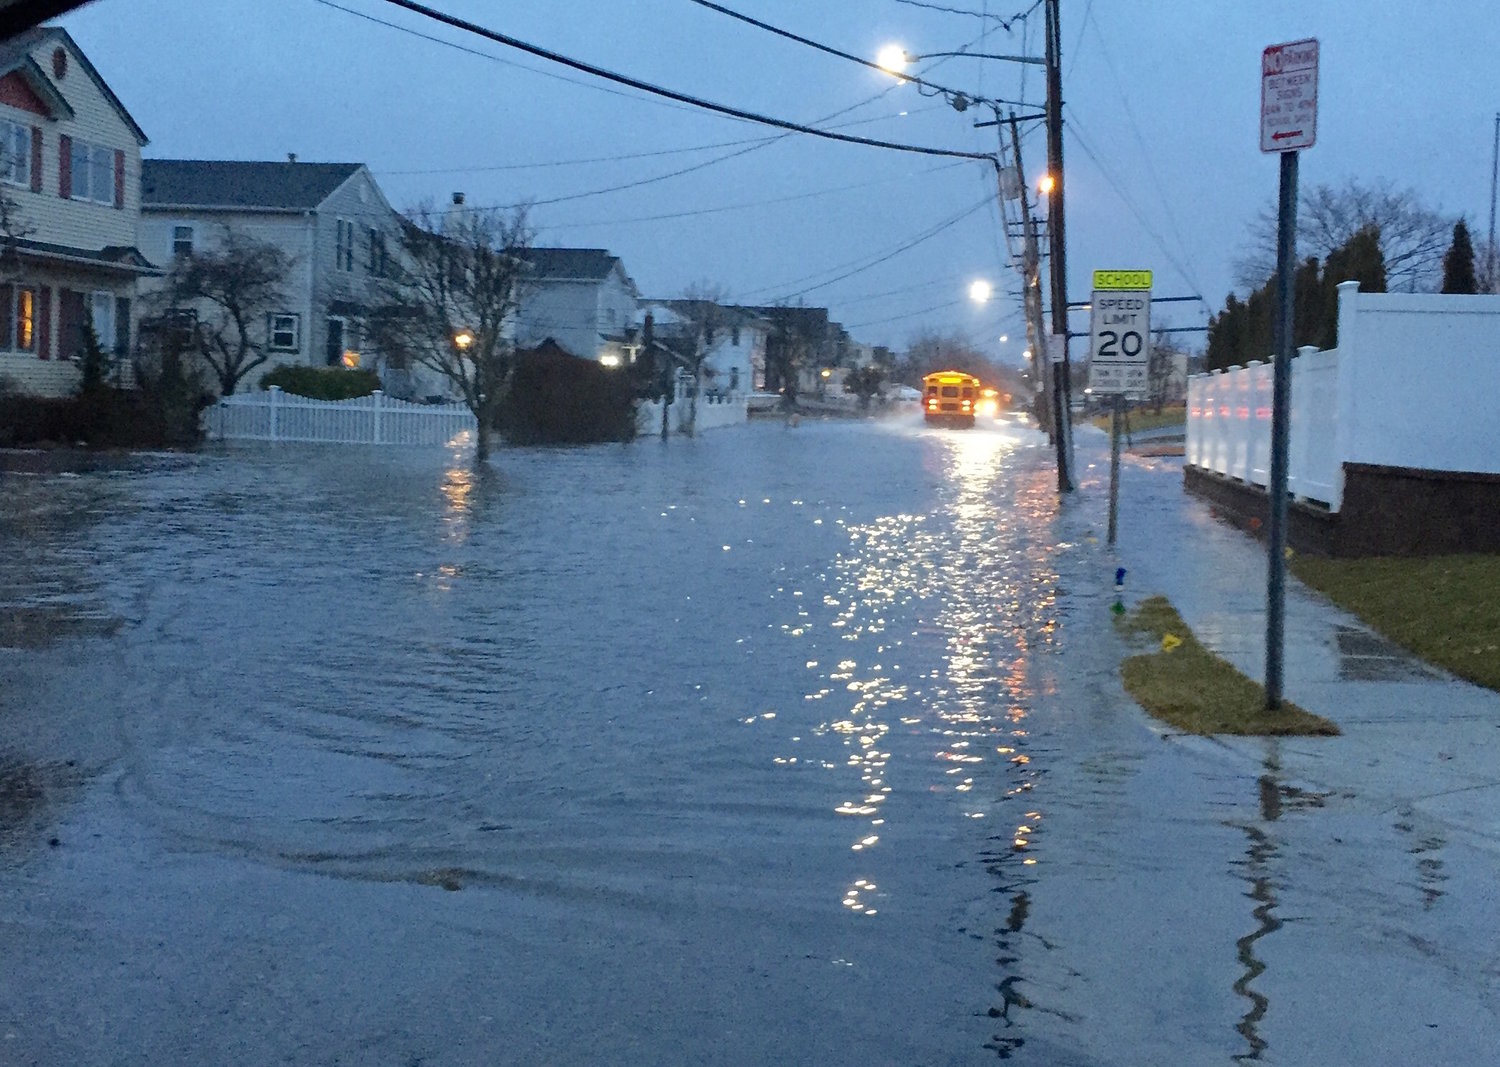
FEMA flood insurance is legally required only for federally backed mortgages inside a Special Flood Hazard Area. More than half of the New York City buildings damaged by Hurricane Sandy sat outside the mapped 100-year floodplain, per CityRealty’s reporting, which is why brokers on the South Shore treat block-level exposure, not zone-map membership alone, as the real question.
Merrick sits within FEMA Zone A, the designation covering most of Long Island’s South Shore canal and bay communities from Freeport through Bellmore, per K&N Insurance’s regional flood guide. Canal-adjacent Merrick homes typically carry NFIP premiums in the $800 to $1,500 per year range. Redfin’s climate-risk model puts 64% of Merrick properties at meaningful flood exposure over a 30-year horizon, well above what a buyer would guess from a listing photo of a dry basement in July.
| Flood factor | Merrick-specific figure | What it means |
|---|---|---|
| Zone designation | FEMA Zone A, South Shore canal belt | Mandatory NFIP purchase if the mortgage is federally backed |
| 30-year property risk share | 64% of Merrick properties | Applies even to homes that look inland on a map |
| Typical canal-parcel NFIP premium | $800 to $1,500/year | Add this to carrying-cost math before making an offer |
| Sandy-era floodplain accuracy | Over half of damaged NYC buildings were outside the mapped zone | A clean flood-zone lookup isn’t a guarantee |
A flood-zone lookup that comes back clean is a data point, not a guarantee, on this stretch of the South Shore.
Is Merrick, NY a flood zone? Much of it sits in FEMA Zone A, particularly the canal and waterfront blocks; homes farther from the water can still carry exposure that a zone lookup alone won’t show.
Schools: two K-6 districts, one shared high school district
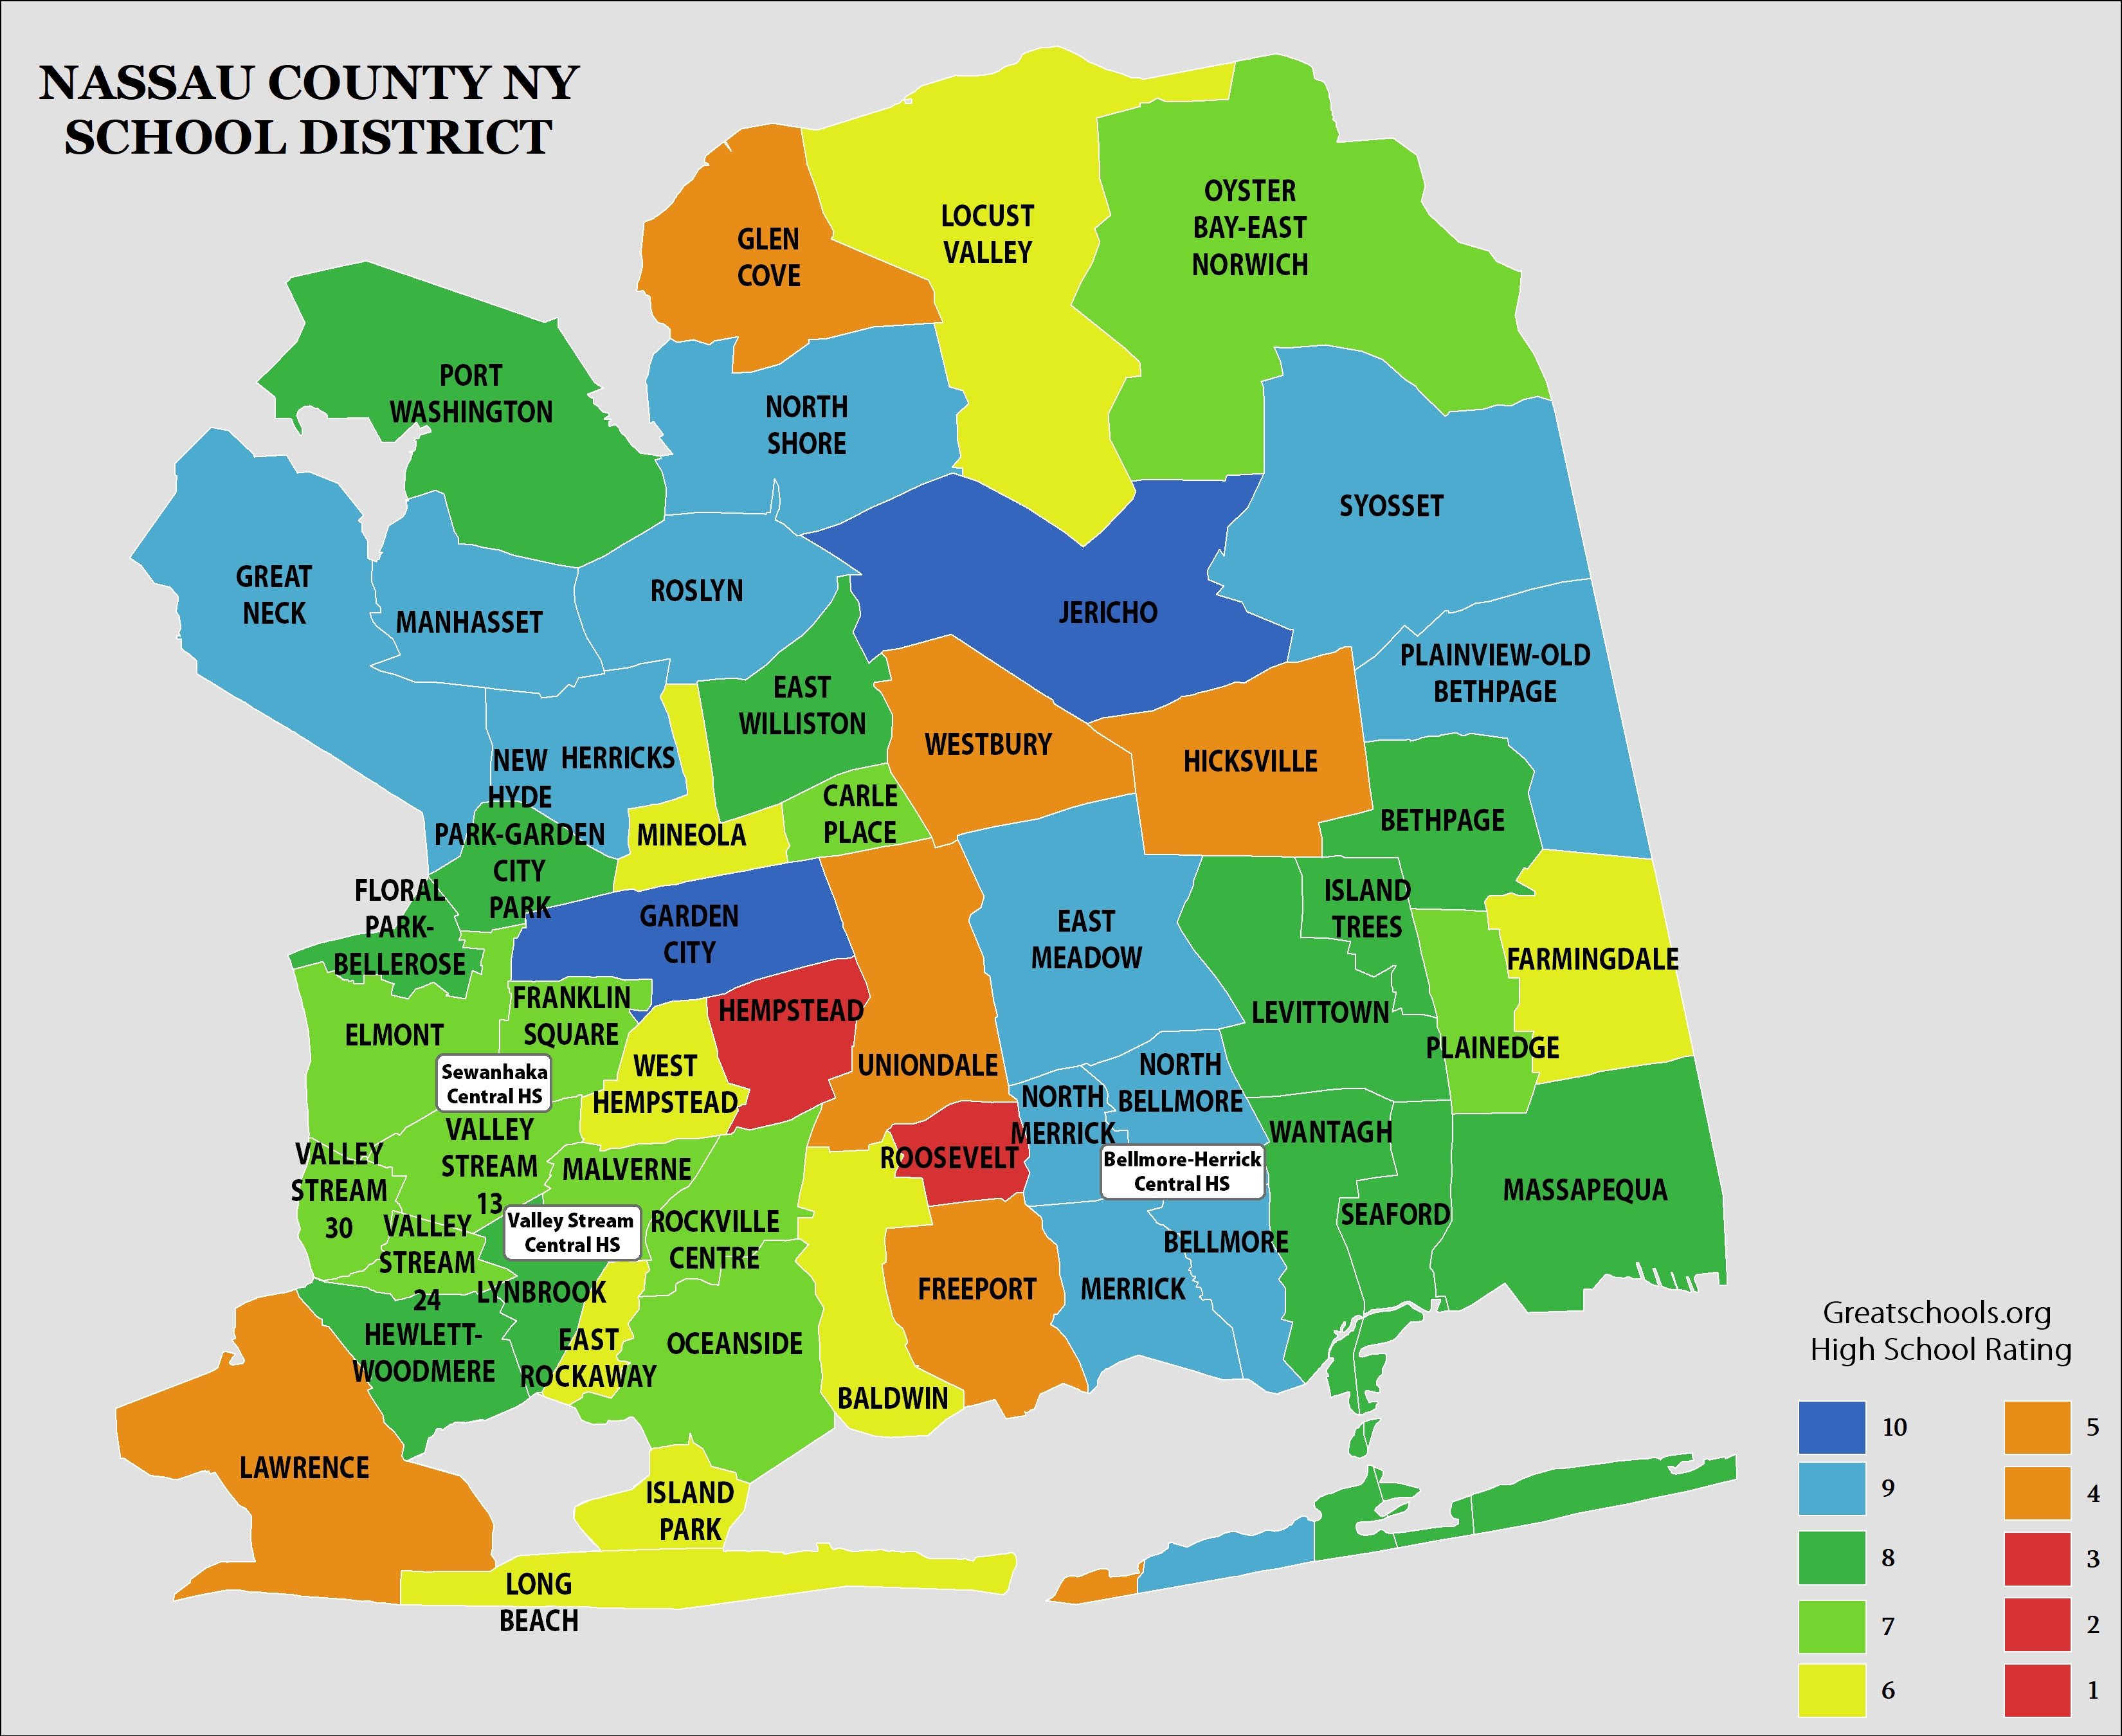
Merrick addresses split between two separate K-6 school districts before funneling into a single high school district, and the split does not reliably follow the “Merrick” name on an envelope.
| District | Grades | Schools | Feeds into |
|---|---|---|---|
| Merrick UFSD | PK-6 | Birch, Chatterton, Norman J. Levy Lakeside | Bellmore-Merrick Central HSD |
| North Merrick UFSD | PK-6 | Camp Avenue, H.D. Fayette, Old Mill Road | Bellmore-Merrick Central HSD |
| Bellmore-Merrick Central HSD | 7-12 | Grand Avenue MS, Merrick Avenue MS, plus Kennedy, Calhoun, and Mepham High Schools | N/A |
A real estate guide covering Merrick schools sums it up plainly: boundaries between Merrick UFSD and North Merrick UFSD don’t always align with postal city names, and the only reliable way to confirm a specific address is to call the district registrar directly rather than assume the mailing address settles it.
What school district is my Merrick address zoned for? It depends on the specific block, not the hamlet name on the address; contact the Merrick UFSD or North Merrick UFSD registrar directly with the exact address before assuming an elementary zone.
The commute, honestly
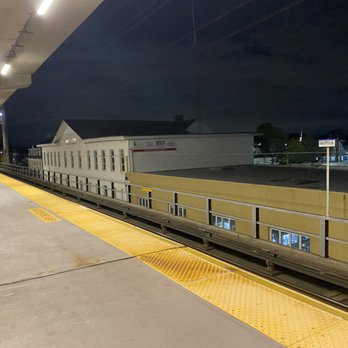
The fastest scheduled LIRR run from Merrick to Penn Station takes 42 minutes. Door-to-door, factoring in the walk to the platform and the walk from Penn Station, one South Shore brokerage’s neighborhood guide puts the realistic range at 45 to 55 minutes each way, the only source found this session giving a door-to-door estimate rather than a scheduled train time. Driving in via the Southern State Parkway runs 45 to 70 minutes depending on traffic, with westbound peak-hour trips regularly landing at the high end.
Investing in Merrick against the county benchmark

Merrick’s appreciation outpaced the county in the trackers measuring the same period: Redfin shows Merrick up 13.8% year over year for May 2026 against Nassau County’s single-family gain of 9.9% for the same month, per OneKey MLS data reported by a Long Island brokerage. Median asking rent in Merrick runs $2,900 to $3,634 per month depending on the source. Divided against a roughly $862,500 median sale price, that works out to a gross rent-to-price ratio near 4.0% to 5.1% before taxes, insurance, and vacancy, a rough ceiling for comparing a purchase to a rental rather than a firm cap-rate figure.
| Metric | Merrick figure | Nassau County / regional benchmark |
|---|---|---|
| YoY price appreciation | 13.8% (Redfin, all home types, May 2026) | 9.9% (OneKey MLS, single-family, May 2026) |
| Median monthly rent | $2,900 to $3,634 | Not directly comparable across sources |
| Gross rent-to-price ratio (calculated) | ~4.0% to 5.1% | Industry forecasts call for 4% to 7% regional appreciation through year-end |
| Median days on market | 29 to 44, by tracker | 32 (Nassau, 3-month average, Redfin) |
Merrick’s edge over the county benchmark held for one reporting month; a single month of faster appreciation is a data point on the current cycle, not a multi-year projection.
Is Merrick a good rental or investment market? The gross rent-to-price ratio runs roughly 4% to 5%, which is modest for a pure income play but consistent with a high-appreciation, low-cash-flow South Shore commuter market rather than a cash-flow rental market.
Common mistakes buyers and sellers make in this market
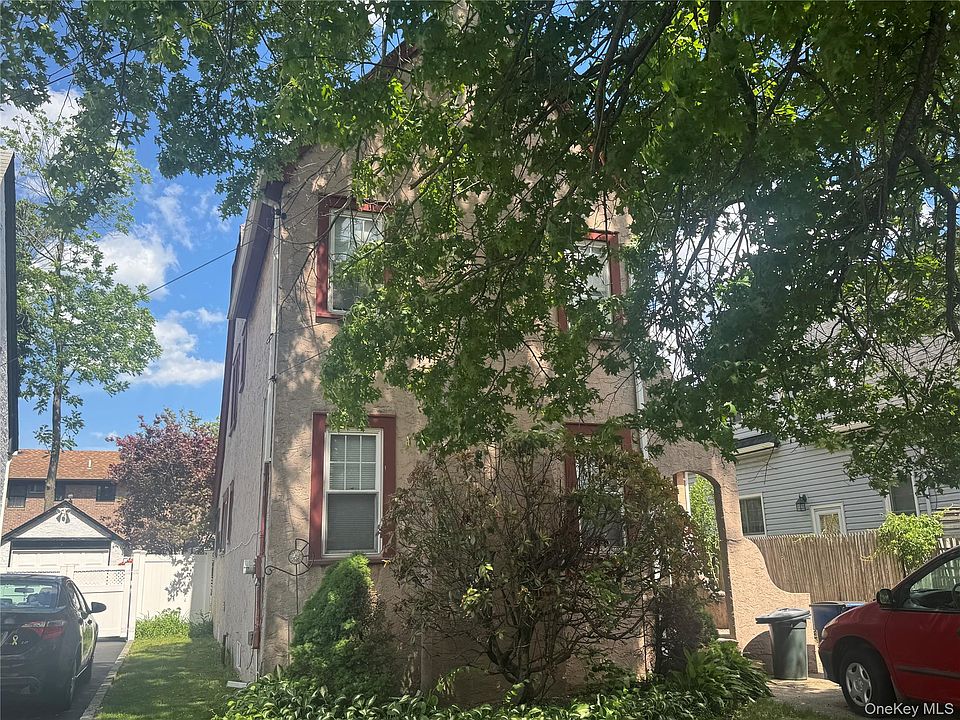
- Trusting one tracker’s median as “the” Merrick price. The trackers above disagree by up to $190,000 depending on geography and averaging window.
- Assuming the mailing address settles the school zone. Confirm with the district registrar, as covered above, before writing an offer contingent on a specific elementary school.
- Skipping the flood-zone check on an inland-looking block. Zone A extends further from the water than casual buyers expect here, as the flood-factor table above shows.
- Overpricing “to test the market.” A stale listing invites price-reduction assumptions faster in 2026 than it did during the low-rate years.
- Treating Merrick as a cash-flow rental market. The rent-to-price math favors appreciation and long-term holding over immediate yield.
If buying doesn’t pencil out this year
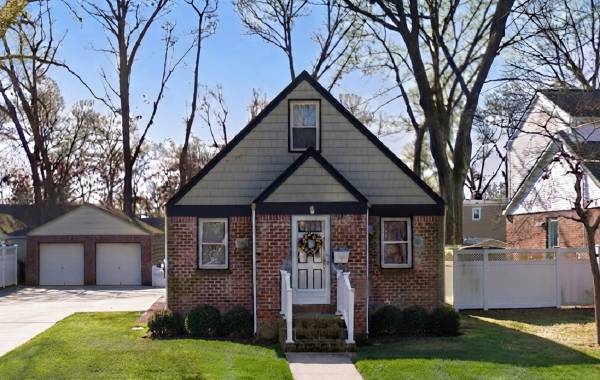
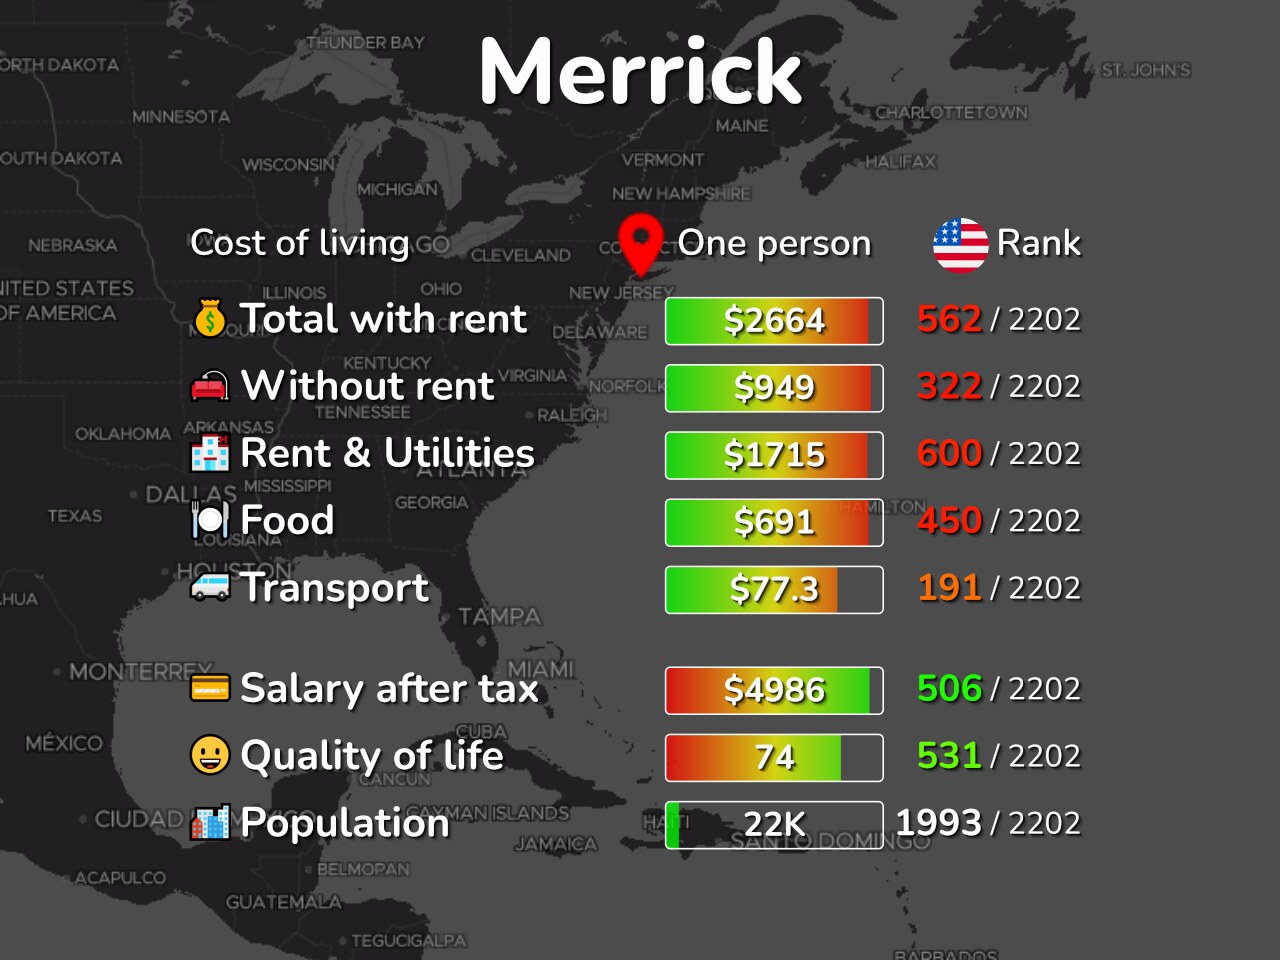
Median asking rent in Merrick runs $2,900 to $3,634 a month, and the town’s overall cost of living sits 49% above the national average. Against the current $863,000 to $933,000 sale-price band, renting a comparable footprint here still costs meaningfully more than most of the country, so the two options are both expensive, and the choice comes down to how long the buyer plans to stay.
Comments