
Kings Park’s Four Named Sub-Areas – and Why Only One Has Public Price Data
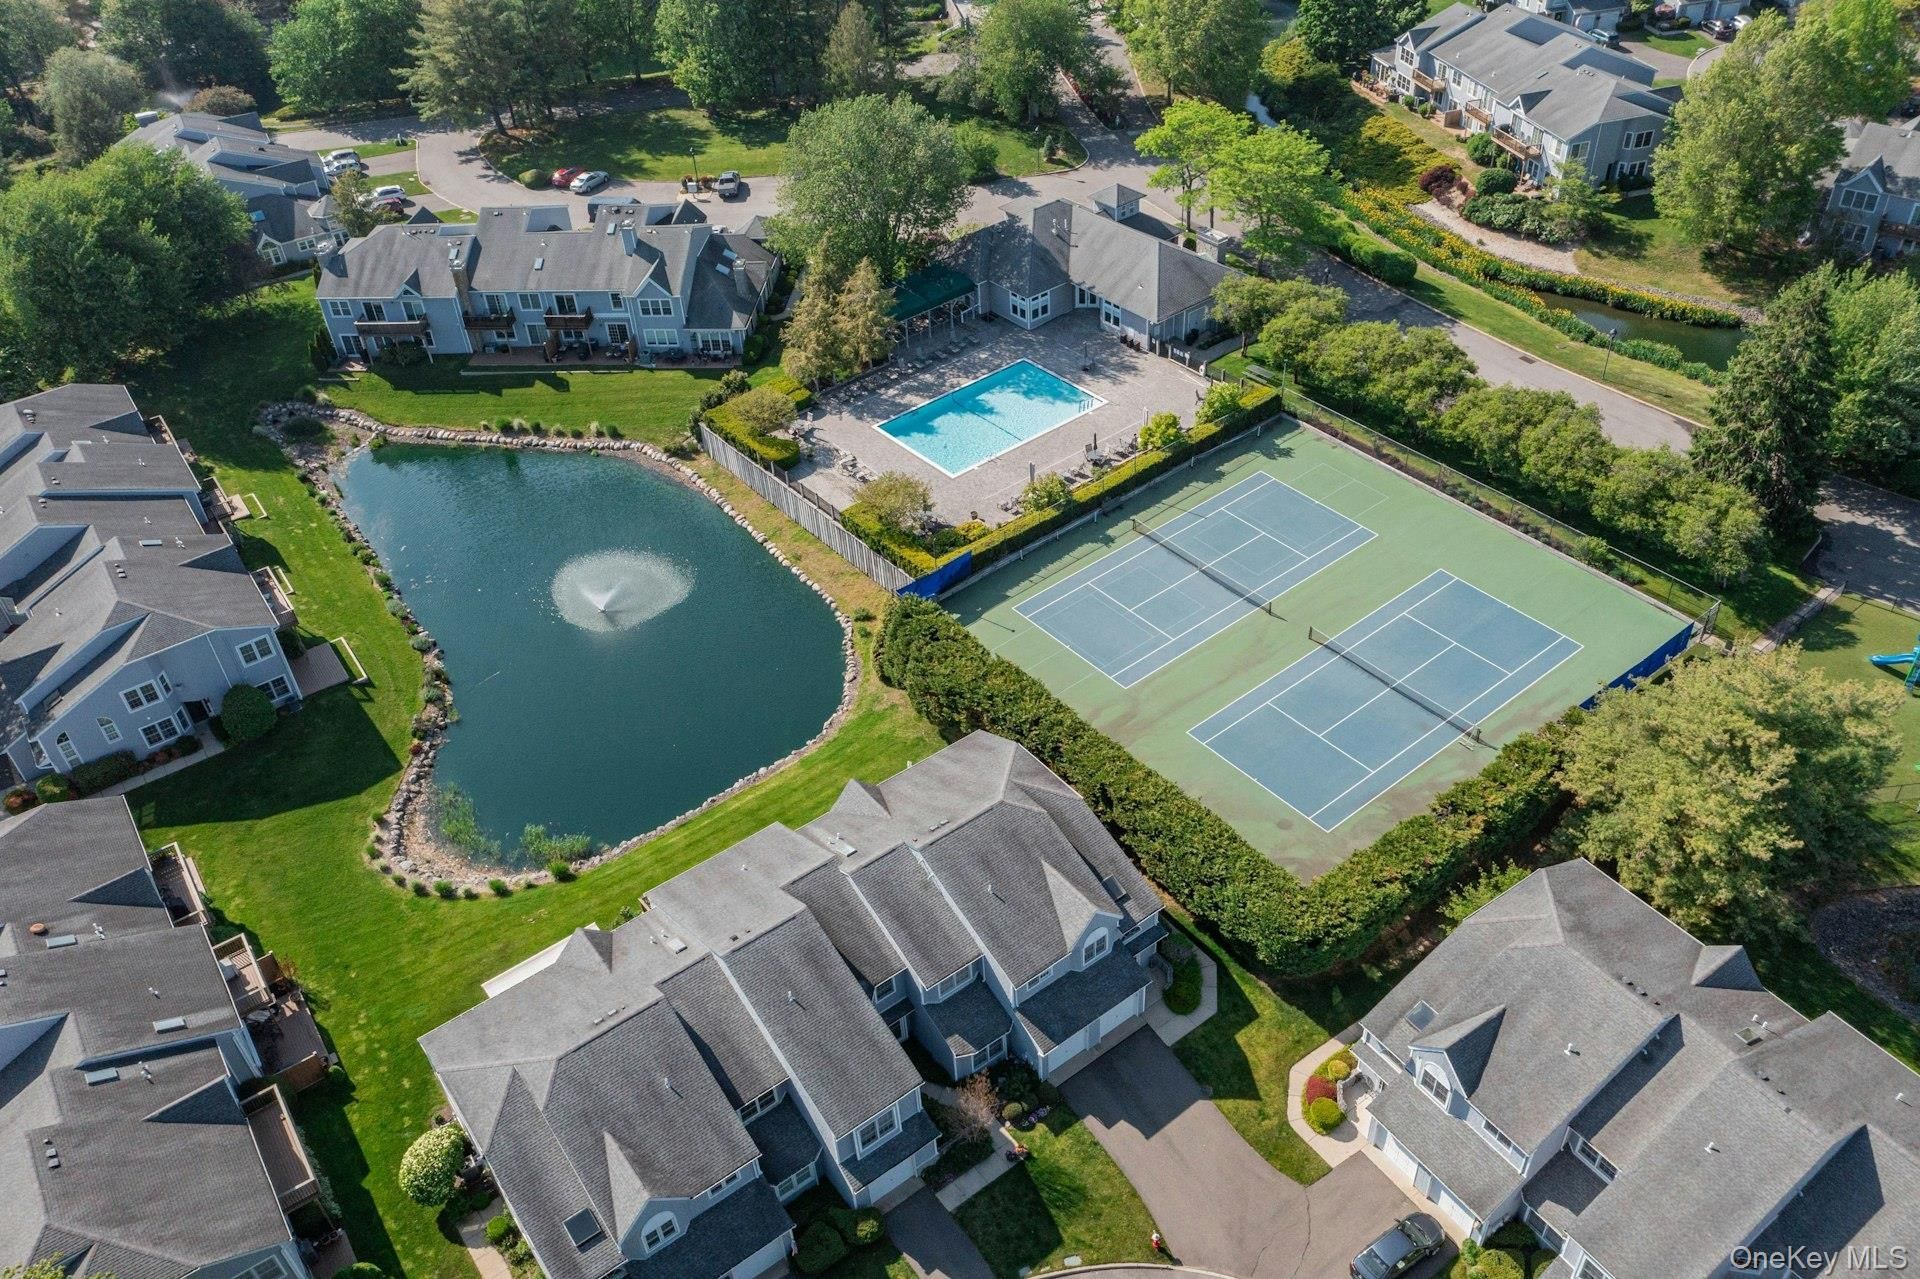
Kings Park isn’t a single price band. Real estate data providers split the hamlet into four named sub-areas: San Remo, Kings Park East, Town Center, and Kings Park North. Only San Remo has an independently published, standalone median: $797,585 per NeighborhoodScout, more expensive than most New York neighborhoods by that ranking, and corroborated by a $799,000 pending-listing median from Redfin’s San Remo neighborhood page in mid-2025. The other three sub-areas appear in the same providers’ geographic breakdowns but without a segmented sold-price figure a buyer can point to.
San Remo sits north of NY-25A along the Nissequogue River, anchored by the San Remo Civic Association park; listing language repeatedly ties it to water proximity and walkability to the waterfront. Kings Park East borders Nissequogue River State Park to the east. Town Center wraps the Main Street corridor around the LIRR station and the business district. Kings Park North runs toward Sunken Meadow State Park and the Sound.
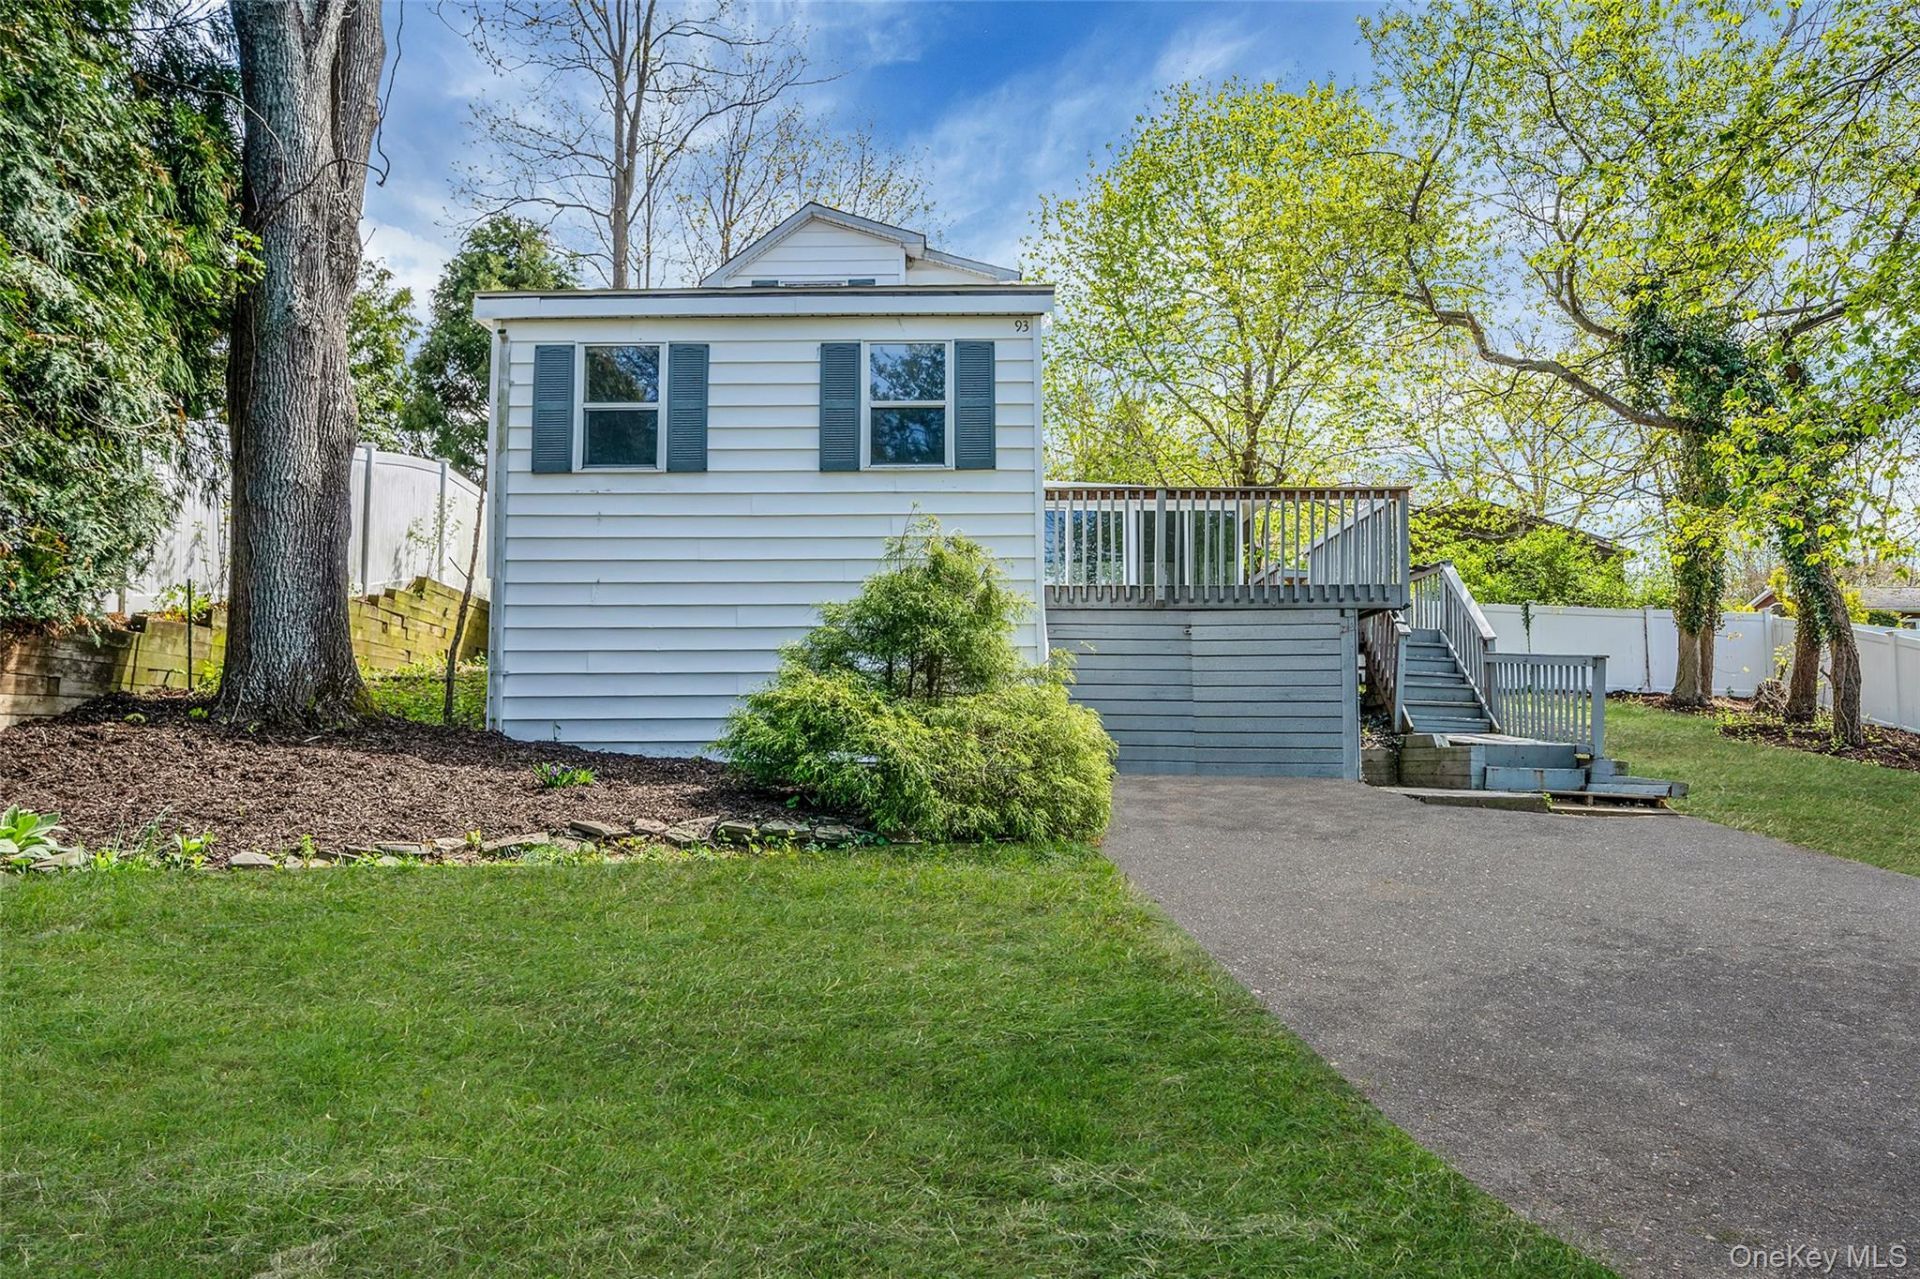
For a buyer comparing sub-areas, the honest state of the data is this: San Remo has a number to check against. For the other three, ask an agent to pull comparable sold prices street by street – a hamlet-wide median will smooth over real differences a single average can’t show.
| Sub-area | Location / character | Price signal | Flood/water exposure |
|---|---|---|---|
| San Remo | North of NY-25A, along the Nissequogue River | $797,585 median (NeighborhoodScout); $799,000 pending median (Redfin) | Highest – direct river frontage |
| Kings Park East | Borders Nissequogue River State Park | No independently published median found | Moderate – adjoins park wetlands |
| Town Center | Main Street corridor, around the LIRR station | No independently published median found | Low – inland |
| Kings Park North | Toward Sunken Meadow State Park and the Sound | No independently published median found | Elevated – near Sound shoreline |
Current Market Snapshot
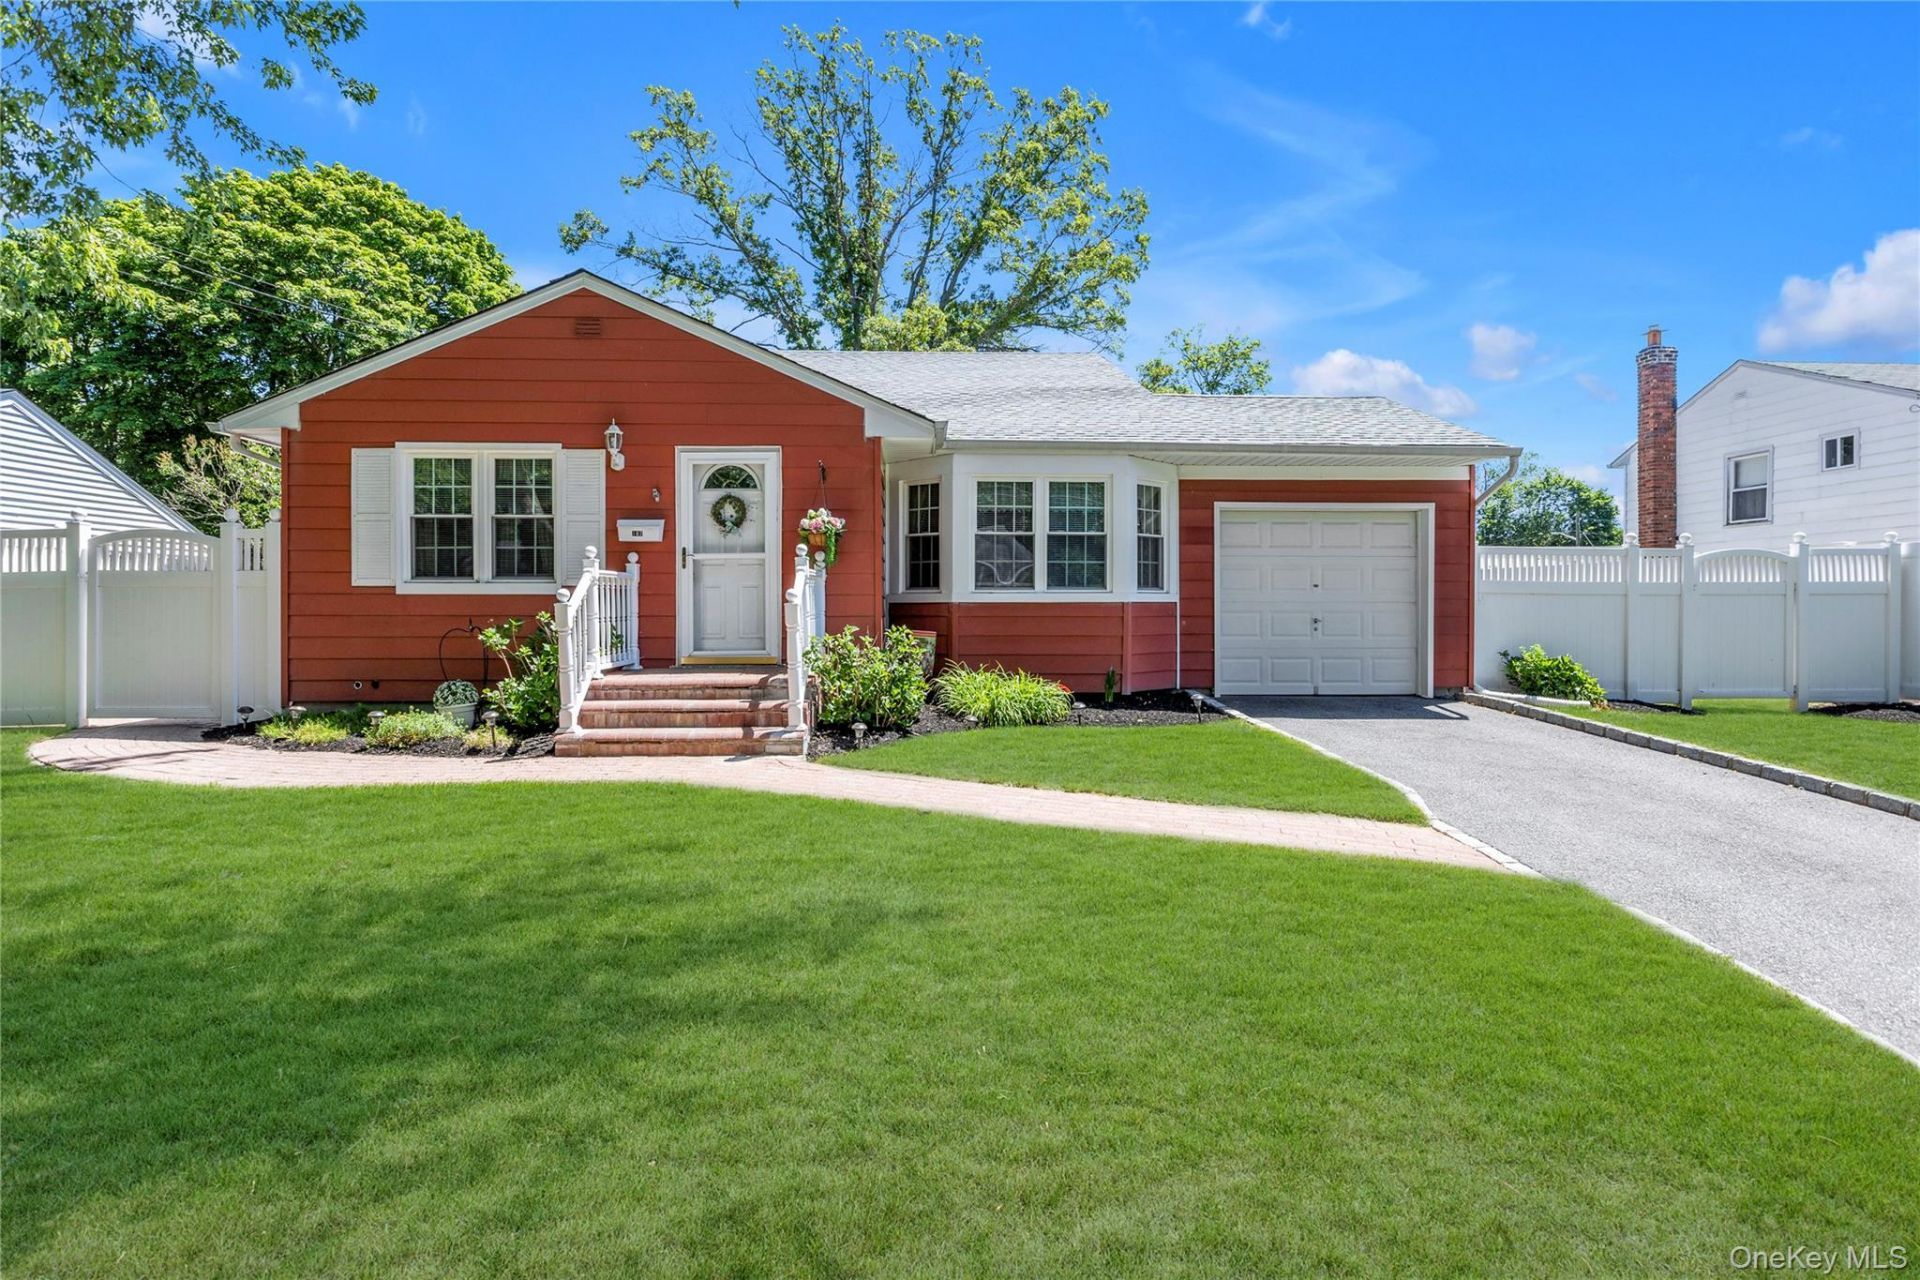
Kings Park’s median sale price was $763,250 in March 2026, up 19.3% year over year. Listings currently sell in about 31 to 33 days on market, and the median price per square foot runs around $399. Active inventory spans $639,000 to $1,499,000, with a median list price near $717,000 to $749,000 depending on the month sampled.
One number worth flagging separately: the Census Bureau’s 2019–2023 American Community Survey estimate puts Kings Park’s median home value at $595,300 – a figure built from self-reported and assessed values, not live sale prices, which is why it trails the real-time MLS median by more than $150,000. Anyone pricing a purchase off a Census or tax-assessment figure alone is working from a number that lags the actual market.
Schools: Kings Park Central and the Smithtown District Exception
Kings Park Central School District enrolls 2,757 students across 5 schools, with an 11-to-1 student-teacher ratio and per-student spending of $32,339. Ninety-nine point seven percent of its teachers are licensed.
What most guides skip: a Kings Park mailing address does not guarantee assignment to Kings Park Central. Multiple homes currently listed in the 11754 zip code are marketed explicitly as being within the Smithtown Central School District – one listing describes a property on Ernest Court as sitting within the Smithtown School District while carrying a Kings Park address, and another advertises a renovated ranch as located in Smithtown School District with a Kings Park mailing address. The zip code and the school district boundary don’t fully overlap.
Is every home with a Kings Park mailing address in the Kings Park Central School District? No. Active listings inside the 11754 zip code are currently marketed as being within the neighboring Smithtown Central School District. Before assuming district assignment from the mailing address alone, confirm the specific parcel with the district registrar or a school-boundary lookup tool.
Commute and Transit Reality
Direct trains on the LIRR’s Port Jefferson Branch run from Kings Park station to Penn Station in roughly 70 to 80 minutes, depending on the specific departure; some trips require a transfer at Huntington or Jamaica. Kings Park’s average commute time runs longer than the national average.
How long does the direct train from Kings Park to Penn Station take? Published Port Jefferson Branch timetables show direct trips averaging about 70 to 80 minutes; transfer trips can run longer.
Parks, Waterfront, and the Flood-Zone Question
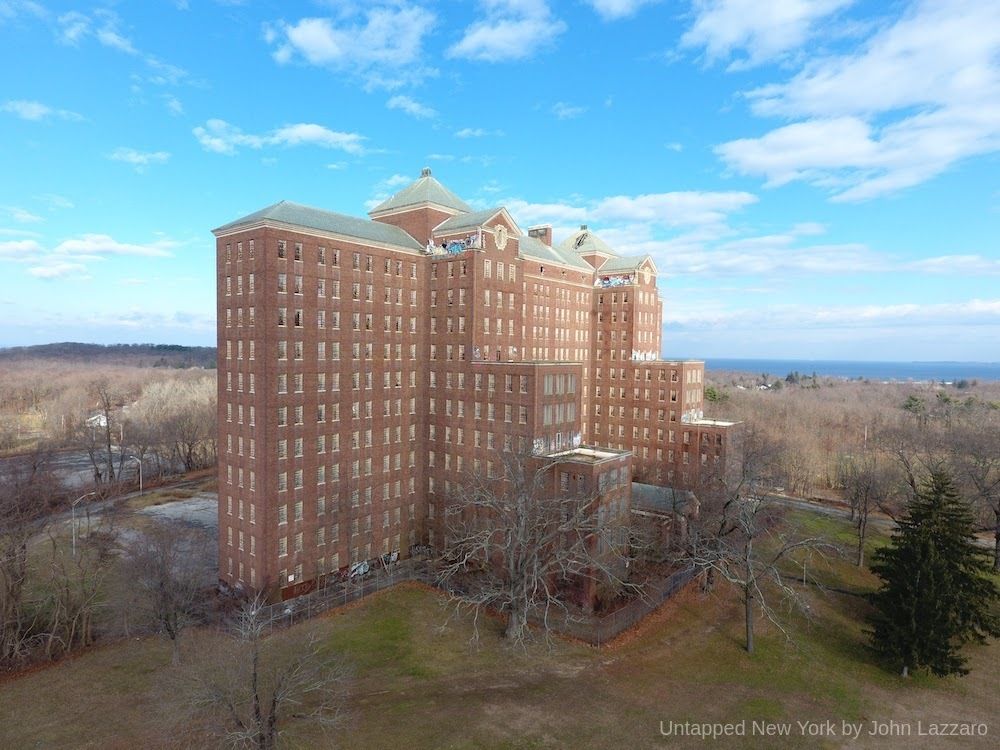
Nissequogue River State Park occupies 522 acres on the former grounds of Kings Park Psychiatric Center, which operated for 111 years before closing in November 1996. Roughly 90% of the former hospital campus is now state parkland. New York’s parks department has announced a master plan that would restore York Hall as a performance and event venue and add multiuse fields, trails, and a farmers’ market – though the remaining vacant hospital buildings are still patrolled by state park police and off-limits to entry, and only 16 of them retain National Register eligibility after a survey downgrade removed the site’s earlier large-district status.
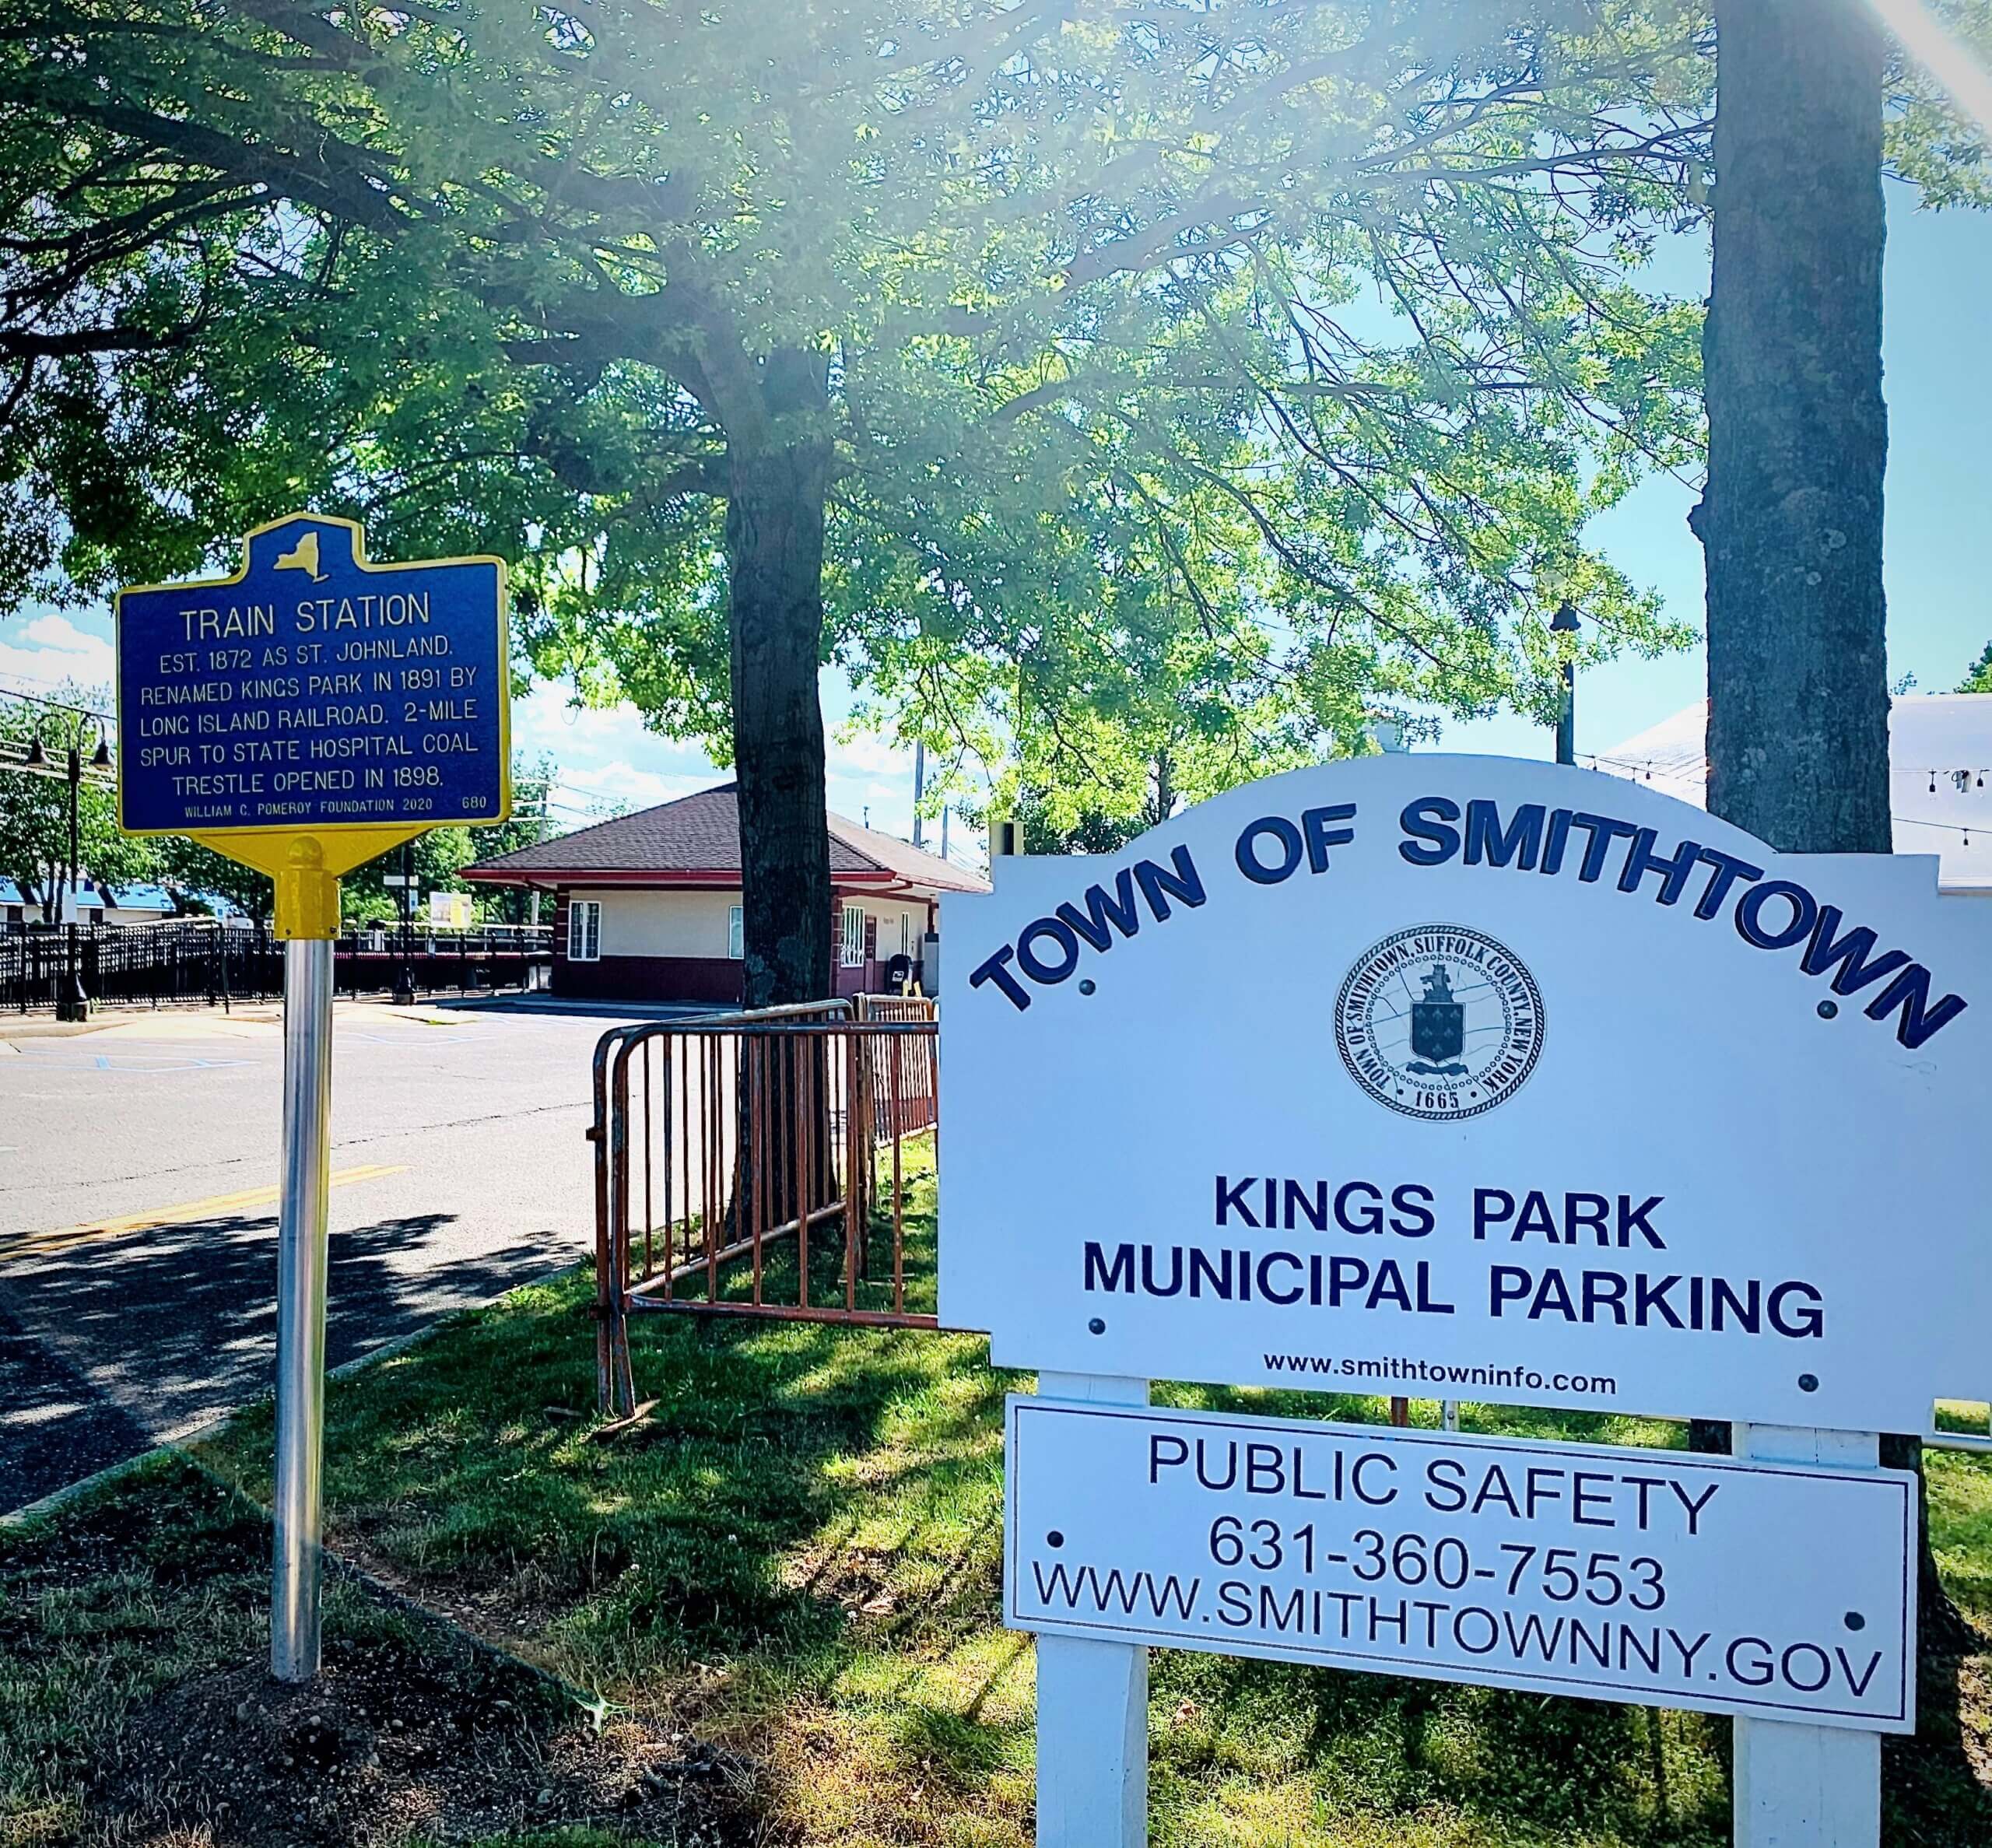
A William G. Pomeroy Foundation historical marker, erected in 2021 on Sunken Meadow Road, records that the adjoining Society of St. Johnland was established in 1866 by the Reverend William Augustus Muhlenberg, an Episcopal clergyman who later founded St. Luke’s Hospital in Manhattan. St. Johnland’s original charitable mission continues today as the St. Johnland Nursing Center on the same road.
On flood risk: no parcel-level FEMA flood zone designation for Kings Park’s waterfront-facing streets turned up in general search. FEMA’s Flood Map Service Center requires an address-level lookup, and that step matters most for San Remo and other North Shore-facing parcels near the Nissequogue River or the Sound.
Is Kings Park at meaningful flood risk? Parts of it likely are, given the Nissequogue River and Long Island Sound frontage, but no general search turned up a parcel-level FEMA flood zone designation. Check the specific address through FEMA’s Flood Map Service Center before purchase, especially in San Remo and other water-facing streets.
Property Taxes and Other Recurring Costs
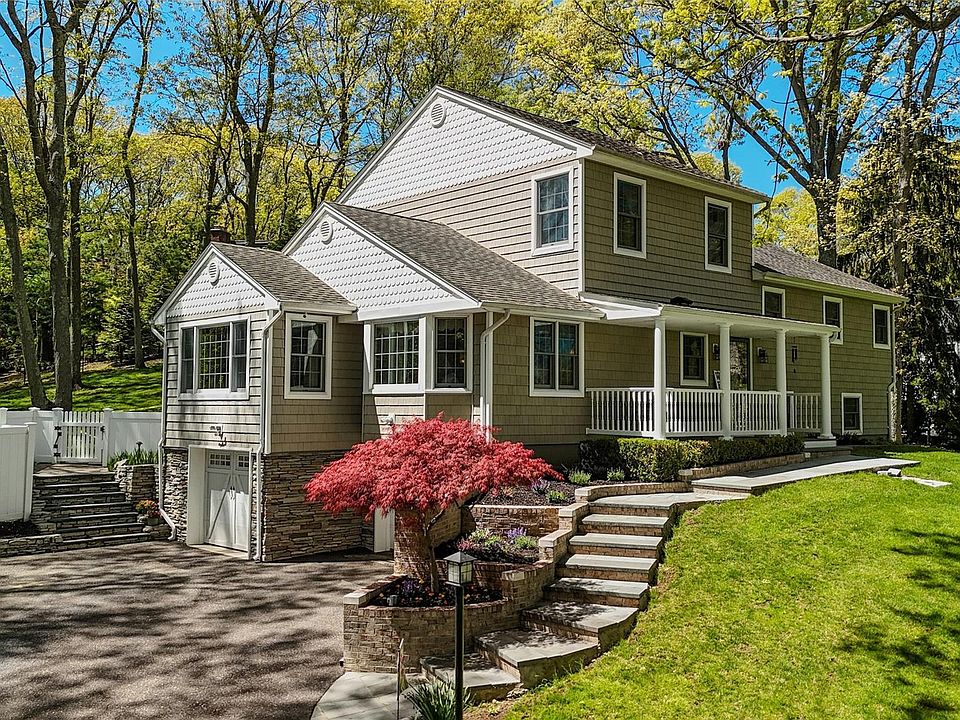
The Town of Smithtown publishes annual tax-rate sheets directly, since every parcel’s bill depends on its specific school and special-district overlay. Two independent estimates put the burden in a comparable range: a Census ACS-based calculation shows a median effective rate near 1.51%, with a typical bill of $10,001 a year on a $661,400 median home; a separate calculation using New York State’s own assessment-roll data for the 2024–25 tax year puts the combined county-town-school core rate at about $20.41 per $1,000 of assessed value. The spread between the two reflects assessed value versus full market value, not two different tax systems. STAR exemptions reduce the bill for primary residences; the exact savings depend on income and exemption type.
What’s the property tax bill likely to be on a median-priced Kings Park home? Applying Smithtown’s roughly 1.51% Census-based effective rate to Kings Park’s April 2026 median list price of about $717,000 works out to roughly $10,800 a year – but the specific school and special-district overlay changes the real number.
Kings Park vs. Neighboring Towns
| Town | Median sale price | Trend | Days on market | Data snapshot |
|---|---|---|---|---|
| Kings Park | $763,250 | +19.3% YoY | 31 to 33 days | Redfin, Mar 2026 |
| Smithtown | $940,000 | +36.2% YoY (thin monthly sample) | 22 to 23 days | Redfin, Jun 2025 |
| Commack | $804,000 | −1.7% YoY | 30 days | Redfin, Jan 2026 |
| Northport | $967,500 | +7.08% MoM | 71 days | Educators Realty (RPR/OneKey MLS), Mar 2026 |
Kings Park undercuts three of its immediate neighbors on price while moving faster than Northport, whose 71-day median reflects a spring inventory surge rather than weak demand. Smithtown’s 36.2% figure comes from a single low-volume month and should be read as directional rather than a stable trend line.
Housing Stock: Recent Sold Comparables
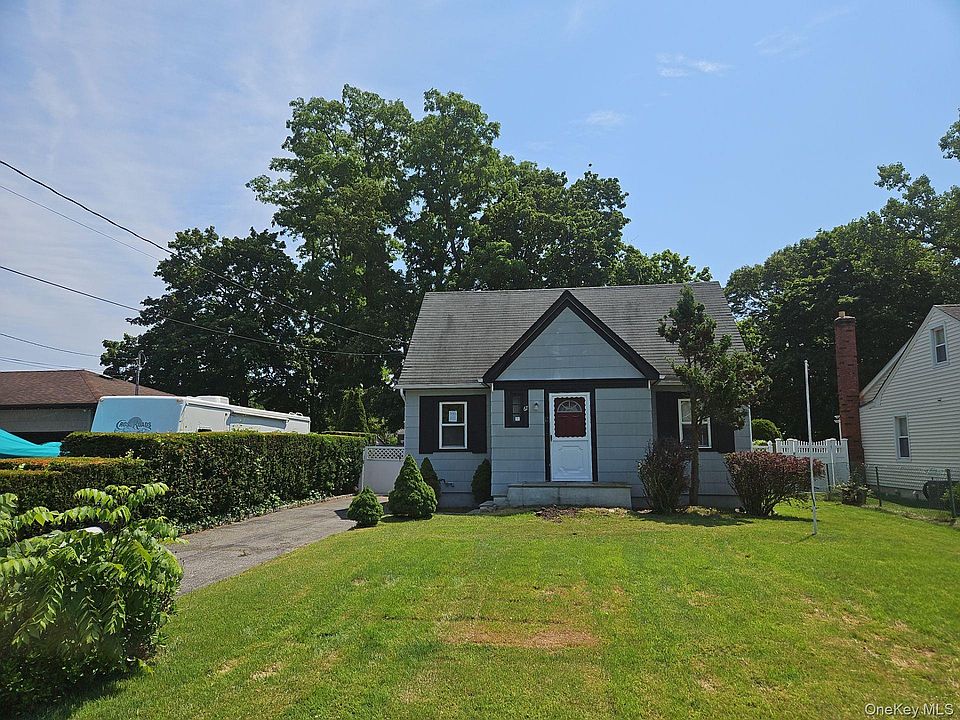
| Address | Type / beds / size | Sold price | Days on market |
|---|---|---|---|
| 16 Maywood Pl | Single-family, 4bd/2ba, 2,684 sqft | $750,000 | 71 |
| 106 Rumford Rd | Single-family, 4bd/3ba, 3,274 sqft | $830,000 | 77 |
| 76 Forest Rd | Single-family, 3bd/3ba | $855,000 | 92 |
| 44 Columbine Ln | Single-family, 3bd/2ba | $650,000 | 92 |
| 2 Ravenwood Dr | Single-family, 2bd/2ba, 1,370 sqft | $730,000 | 119 |
| 70 Lakebridge Dr S #70 | Condo (Lakebridge community), 2bd/2.5ba | $600,000 | 85 |
Source: Redfin sold data, all closed the first week of July 2025. Six real, dated comps aren’t a full statistical sample, but the single Lakebridge condo sold at the lowest price and among the shortest days on market, while every three- and four-bedroom detached house in the set spent 71 days or more before closing despite selling higher – entry-priced inventory here moves fast, and mid-tier detached homes face more negotiation time before closing.
What to Verify Before You Buy
- School district assignment. Pull the district-boundary lookup for the exact parcel rather than the general neighborhood, since active 11754 listings currently span two different districts.
- Flood zone status. Run the exact address through FEMA’s Flood Map Service Center, particularly for San Remo and Sound-facing streets.
- Psychiatric Center adjacency. If a property borders Nissequogue River State Park, ask a lender or insurer directly whether proximity to the vacant, patrolled former hospital buildings affects underwriting, even though the surrounding land is protected parkland.
- Population and demographic figures found online. Sources online cite population numbers from 16,153 to 17,660; the two dated, sourced figures are 17,085 (2020 Decennial Census) and 16,516 (2019–2023 ACS estimate) – treat any other number without a stated vintage skeptically.
- The “most expensive in New York” claim. Unsourced everywhere it appears; use the actual comparison table above instead.
- Property tax bill. Pull the parcel-level number from Smithtown’s own online tax lookup using the property’s tax code, not a percentage-based estimator.
Comments