
Where the Boundaries Sit
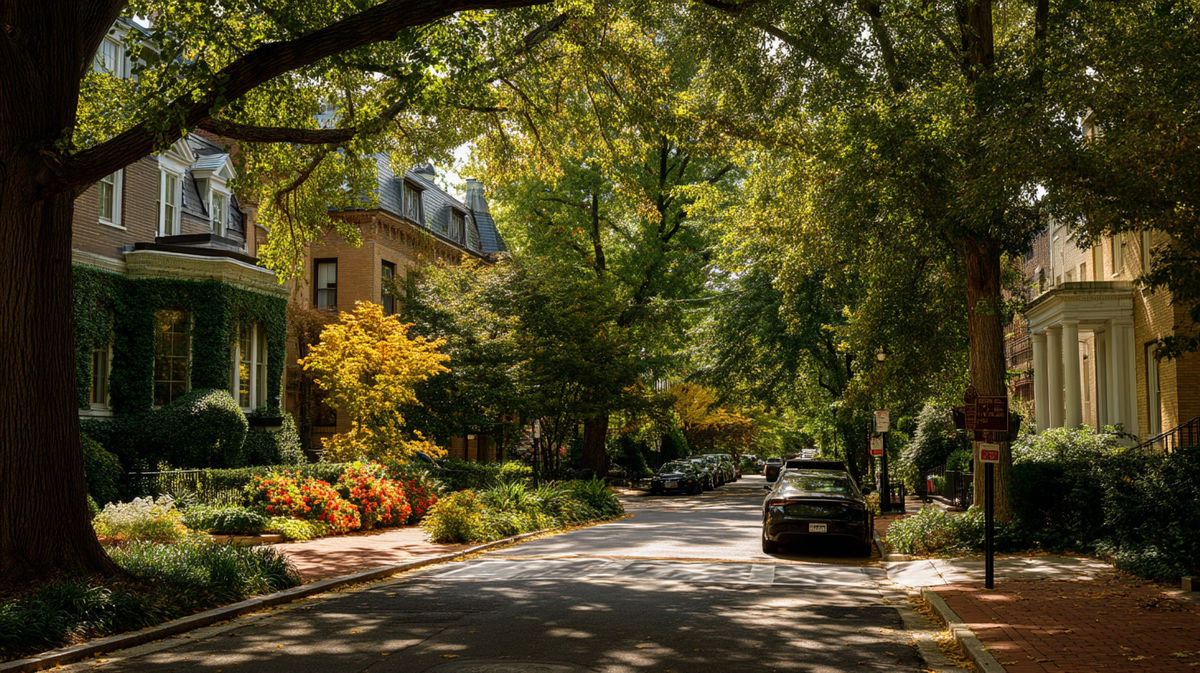
Kalorama sits on the high ground between Adams Morgan and Dupont Circle in Northwest Washington, split down the middle by Connecticut Avenue. West of the avenue is Sheridan-Kalorama: large lots, embassies, and Massachusetts Avenue’s Embassy Row. East of the avenue is Kalorama Triangle, a compact grid of rowhouses and prewar apartment buildings bounded by Connecticut Avenue, Columbia Road, and Calvert Street. The two sit inside separate, independently designated historic districts, which matters more for a buyer than the shared neighborhood name suggests.
Sheridan-Kalorama vs. Kalorama Triangle: The Two Markets
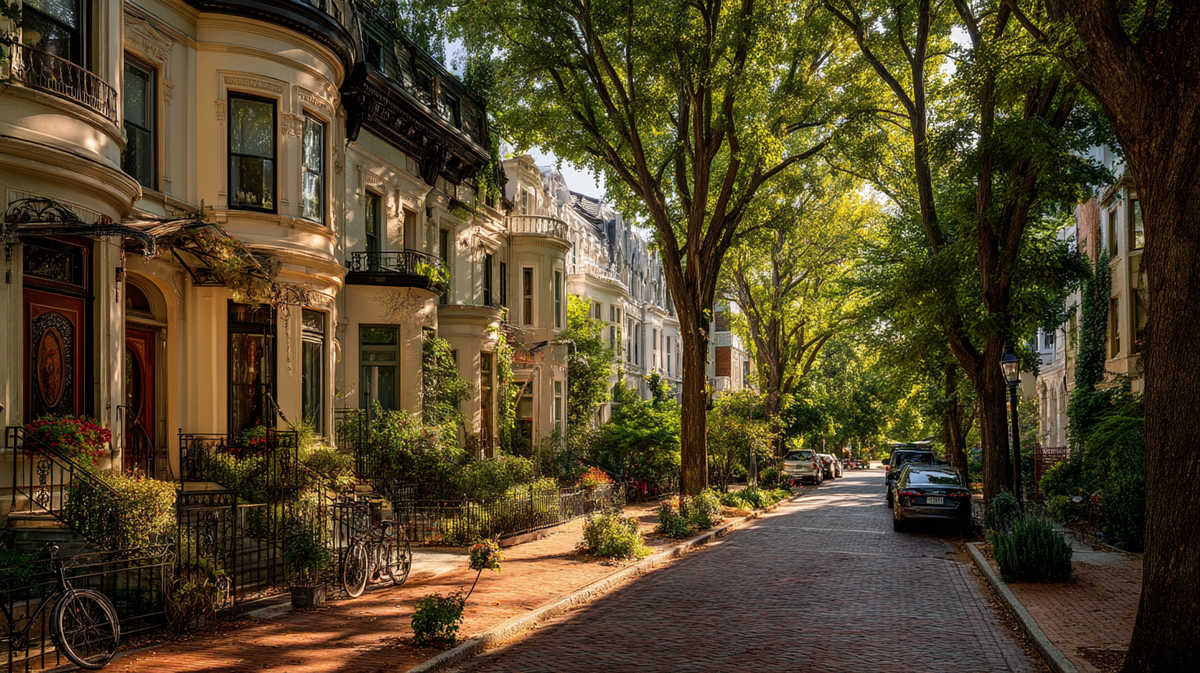
Sheridan-Kalorama trades in detached mansions, embassy conversions, and elegant townhouses; Kalorama Triangle trades in rowhouses and prewar condo conversions, at roughly half the typical reported price.
| Submarket | Typical property type | Recent reported price tier | Historic district designated | Typical buyer profile |
|---|---|---|---|---|
| Sheridan-Kalorama | Mansions, embassy conversions, elegant townhouses | $890,000 to $2,700,000 median, depending on source and month (see below) | 1989; period of significance 1890 to 1945 | Embassy-adjacent buyers and diplomatic missions; move-up single-family buyers prioritizing privacy and lot size |
| Kalorama Triangle | Rowhouses, prewar apartment conversions, condos | $1,160,750 median, Mar 2025 (2 sales) | 1987; period of significance 1893 to 1939 | First-time luxury-adjacent buyers, walkability-focused households, and rowhouse-to-multi-unit investors |
| Adams Morgan / Kalorama Heights / Lanier Heights (bordering) | Apartments, smaller condos | $712,000 median, Dec 2025 | Not part of either historic district | Renters transitioning to ownership; investors seeking lower entry points |
The price gap is not only square footage. Sheridan-Kalorama’s district covers roughly 190 acres of large-lot, architect-designed construction from 1890 to 1945; Kalorama Triangle’s district covers about 51 acres of rowhouses and apartment buildings from 1893 to 1939, most under 20 feet wide.
Is Sheridan-Kalorama the same neighborhood as Kalorama Triangle?
No. They are two separately designated historic districts split by Connecticut Avenue: Sheridan-Kalorama to the west (1989 designation, mansions and embassies) and Kalorama Triangle to the east (1987 designation, rowhouses and prewar apartments). Listings sometimes use “Kalorama” for both, which is why a single median price for “Kalorama” is unreliable.
What Homes Cost, and Why the Portals Disagree
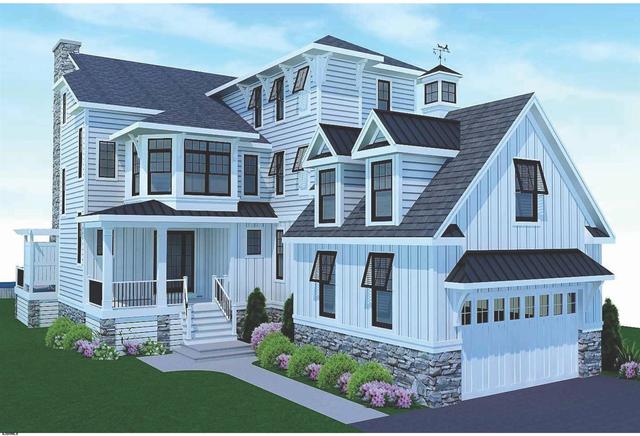
Three separate sources reported three different Sheridan-Kalorama medians inside a 12-month window: $890,000, $1,265,000, and $2,700,000.
Redfin’s Sheridan-Kalorama Historic District page put the December 2025 median sale price at $890,000 across 17 closings, up from a prior-year month that recorded only 12 sales. A separate Redfin summary for the same district reported a $1,265,000 median for March 2026. Homes.com’s rolling 12-month figure, current as of May 2025, was $2,700,000, with active listings that month ranging from $3,799,000 to $8,750,000.
For a buyer, the workaround is to ask an agent for the trailing 90-day list of closed sales inside the specific historic district, sorted by property type, rather than anchoring on one portal’s headline number.
Why does the median price for Sheridan-Kalorama look so different from one site to the next?
The district sells only a handful of homes most months, and each source samples a different window and property mix. Redfin’s December 2025 figure ($890,000) reflected a month heavy in condo sales; Redfin’s March 2026 figure ($1,265,000) reflected a different mix; Homes.com’s 12-month rolling figure ($2,700,000) leaned toward single-family and mansion-scale closings. Ask for the underlying sale list, not the headline median.
Reading Days on Market and Inventory Correctly
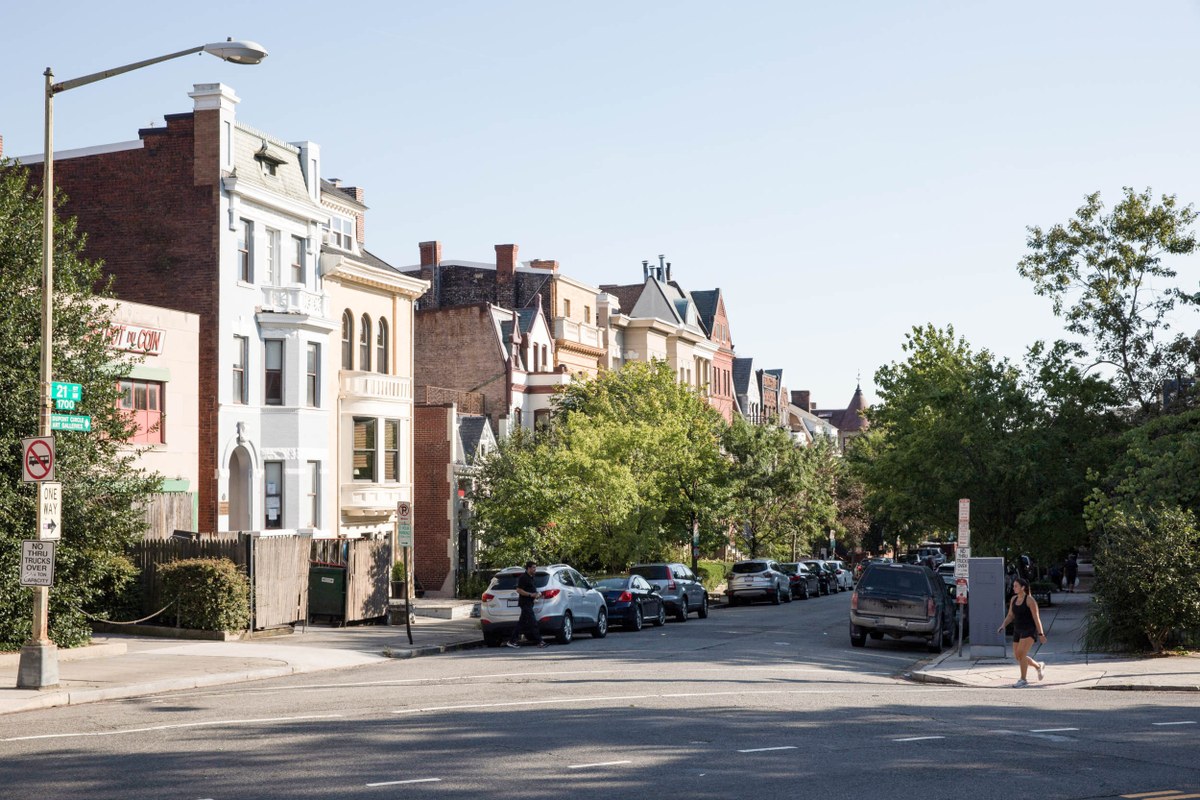
Ninety-eight days is normal in Sheridan-Kalorama; two weeks is normal in Kalorama Triangle, and the difference says more about market segment than desirability.
| DOM range | Likely meaning | What to check next |
|---|---|---|
| Under 30 days | Priced near market value, broad appeal, sometimes a cash buyer | Confirm no post-inspection price cut; check list-to-sale ratio |
| 30 to 90 days | Normal for the luxury segment; financing or customization complexity | Check months-of-inventory and whether a comparable size sold recently |
| 90+ days | Overpricing, condition issues, or a seller testing the market | Pull permit history and confirm the specific block’s contributing-building status |
Sheridan-Kalorama’s reported 98-day average, down from 103 days the prior year, sits in the moderate range this table describes: buyer scarcity at the top end stretches timelines even for well-priced homes. Kalorama Triangle’s 16-day average listing age in the Rocket Homes sample points toward a smaller, faster-moving pool of buyers competing for rowhouses and conversions.
Historic-District Rules for Buyers and Renovators
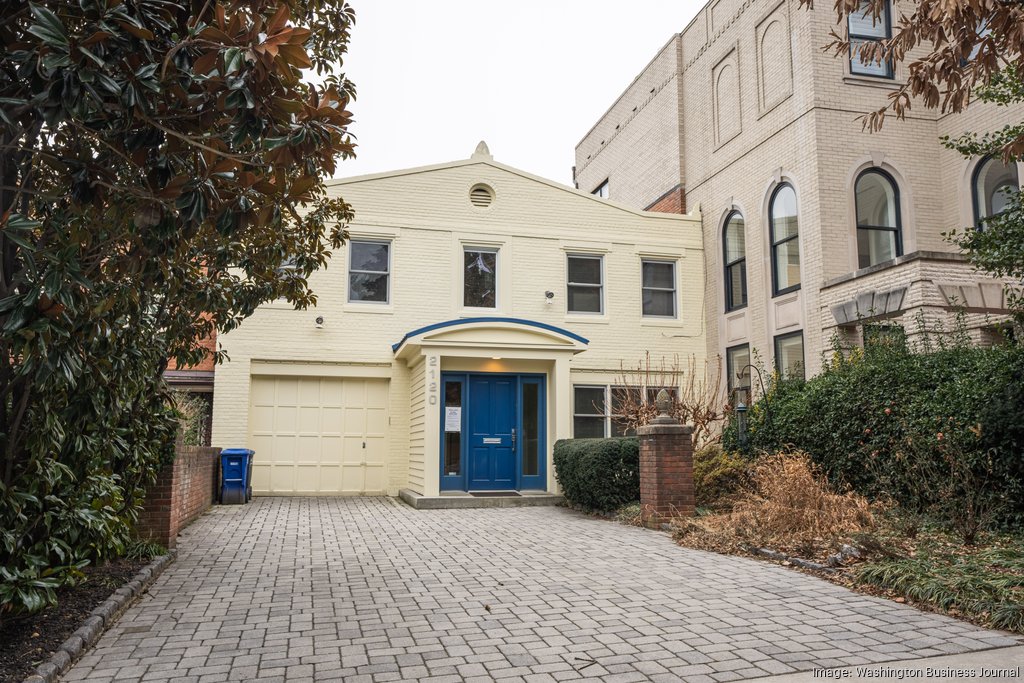
More than 95 percent of preservation-review permit applications in DC clear through Historic Preservation Office staff without a Board hearing, according to the DC Office of Planning; only larger projects reach the monthly Historic Preservation Review Board meeting.
Designation facts for both districts
- Kalorama Triangle Historic District: listed on the DC Inventory of Historic Sites and the National Register in 1987, period of significance 1893 to 1939, per the DC Office of Planning.
- Sheridan-Kalorama Historic District: listed in 1989, period of significance 1890 to 1945, per the DC Office of Planning.
What needs full Board review, and what doesn’t
- Cleared by staff: in-kind repair, small additions, and minor alterations that don’t change historic character, often same-day to five business days.
- Goes to HPRB: larger projects, sizable additions, new construction, and anything not delegated to staff, heard at the Board’s monthly public meeting (none in August).
- Consent calendar vs. full agenda: uncontested cases with no ANC or community objection typically move to the consent calendar; contested cases go to the full agenda, and an ANC can request a 45-day deferral.
The Woodrow Wilson House at 2340 S Street NW, a contributing landmark inside the Sheridan-Kalorama district, has operated as a public museum since 1963, when the National Trust for Historic Preservation opened it following Edith Wilson’s 1961 bequest of the house and roughly 8,400 artifacts.
Do I need Historic Preservation Review Board approval to renovate a house in Kalorama?
Usually not from the Board itself. If your property is a contributing building in either district, in-kind repairs and most minor alterations clear administratively through Historic Preservation Office staff. Full Board review is reserved for larger additions, new construction, and demolition.
Climate and Hazard Exposure

Sheridan-Kalorama carries triple the flood exposure of Kalorama Triangle, and both districts face the same projected jump in extreme-heat days.
| Risk type | Sheridan-Kalorama | Kalorama Triangle | 30-year trend |
|---|---|---|---|
| Severe flood | 3% of properties (21 properties) | 1% of properties | Increasing slower than the national average |
| Severe wind | 100% moderate risk | 100% moderate risk | Gusts to 61 mph today, up to 74 mph in 30 years (hurricane-driven) |
| Severe heat | 98% of homes | Same citywide trend applies | 128% increase in days over 105°F, from about 8 days a year today to 16 |
The flood gap traces to topography, not to the historic designation: Sheridan-Kalorama’s lower blocks near Rock Creek Park sit closer to the floodplain than Kalorama Triangle’s higher ground toward Connecticut Avenue.
How much does flood or heat risk affect a Kalorama property?
Flood risk is concentrated: about 3% of properties in Sheridan-Kalorama and 1% in Kalorama Triangle carry severe 30-year flood exposure, per First Street Foundation data reported through Redfin. Heat exposure is shared: both districts are projected to see roughly a 128% increase in days above 105°F over the next 30 years.
Renting in Kalorama: What It Costs Relative to the City
A Kalorama rental runs above the DC-wide average, though not dramatically above bordering Adams Morgan.
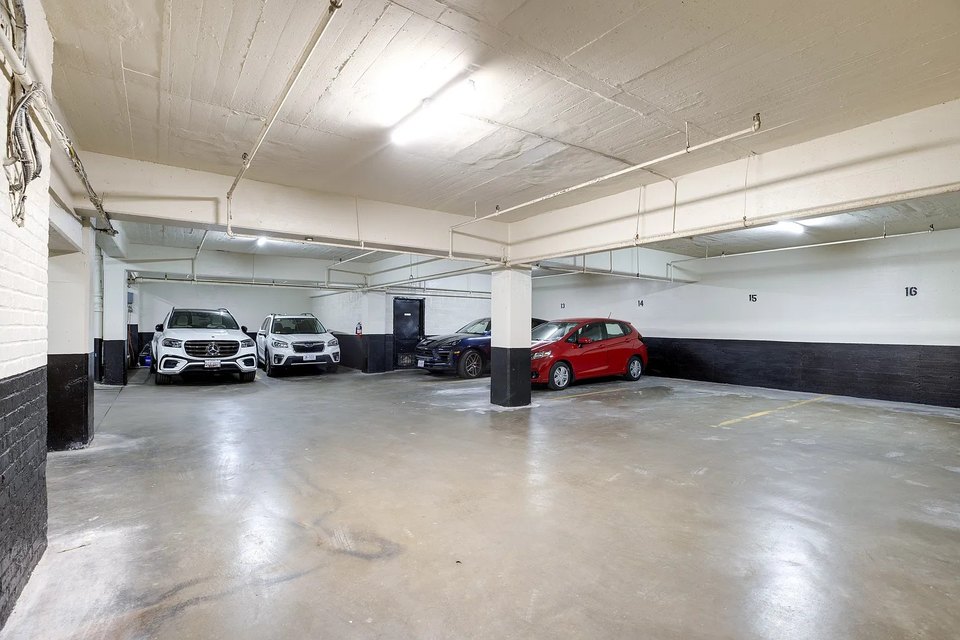
Citywide average rent in Washington was $2,470 a month as of July 2026, per RentCafe’s market analysis. Adams Morgan, the closest comparably walkable submarket bordering Kalorama Triangle, averaged $2,573. Kalorama’s rental inventory skews toward larger, older units in low-rise buildings and converted rowhouses, which pushes per-unit asking rents above the citywide studio and one-bedroom averages even where per-square-foot pricing is comparable.
Buyer and Seller Playbooks
Buyer
- Pull the trailing 90-day closed-sale list for the specific district, not a blended “Kalorama” figure, before anchoring on price.
- Confirm contributing-building status before assuming what renovation work is possible.
- Budget extra weeks for appraisal support on non-standard, mansion-scale Sheridan-Kalorama properties above $2 million; comparable sales are thin enough that appraisers often need supplemental data.
Seller
- Expect thin-sample comparisons: a Sheridan-Kalorama listing gets judged against whatever handful of homes closed in the same rolling window, so one over- or underpriced comp skews perception.
- Price to recent rowhouse comps in Kalorama Triangle; the district’s faster typical listing age means overpricing shows up as a stale-listing signal rather than a slow price grind.
Comments