
What Homes Cost Right Now, and Why the Number Moves
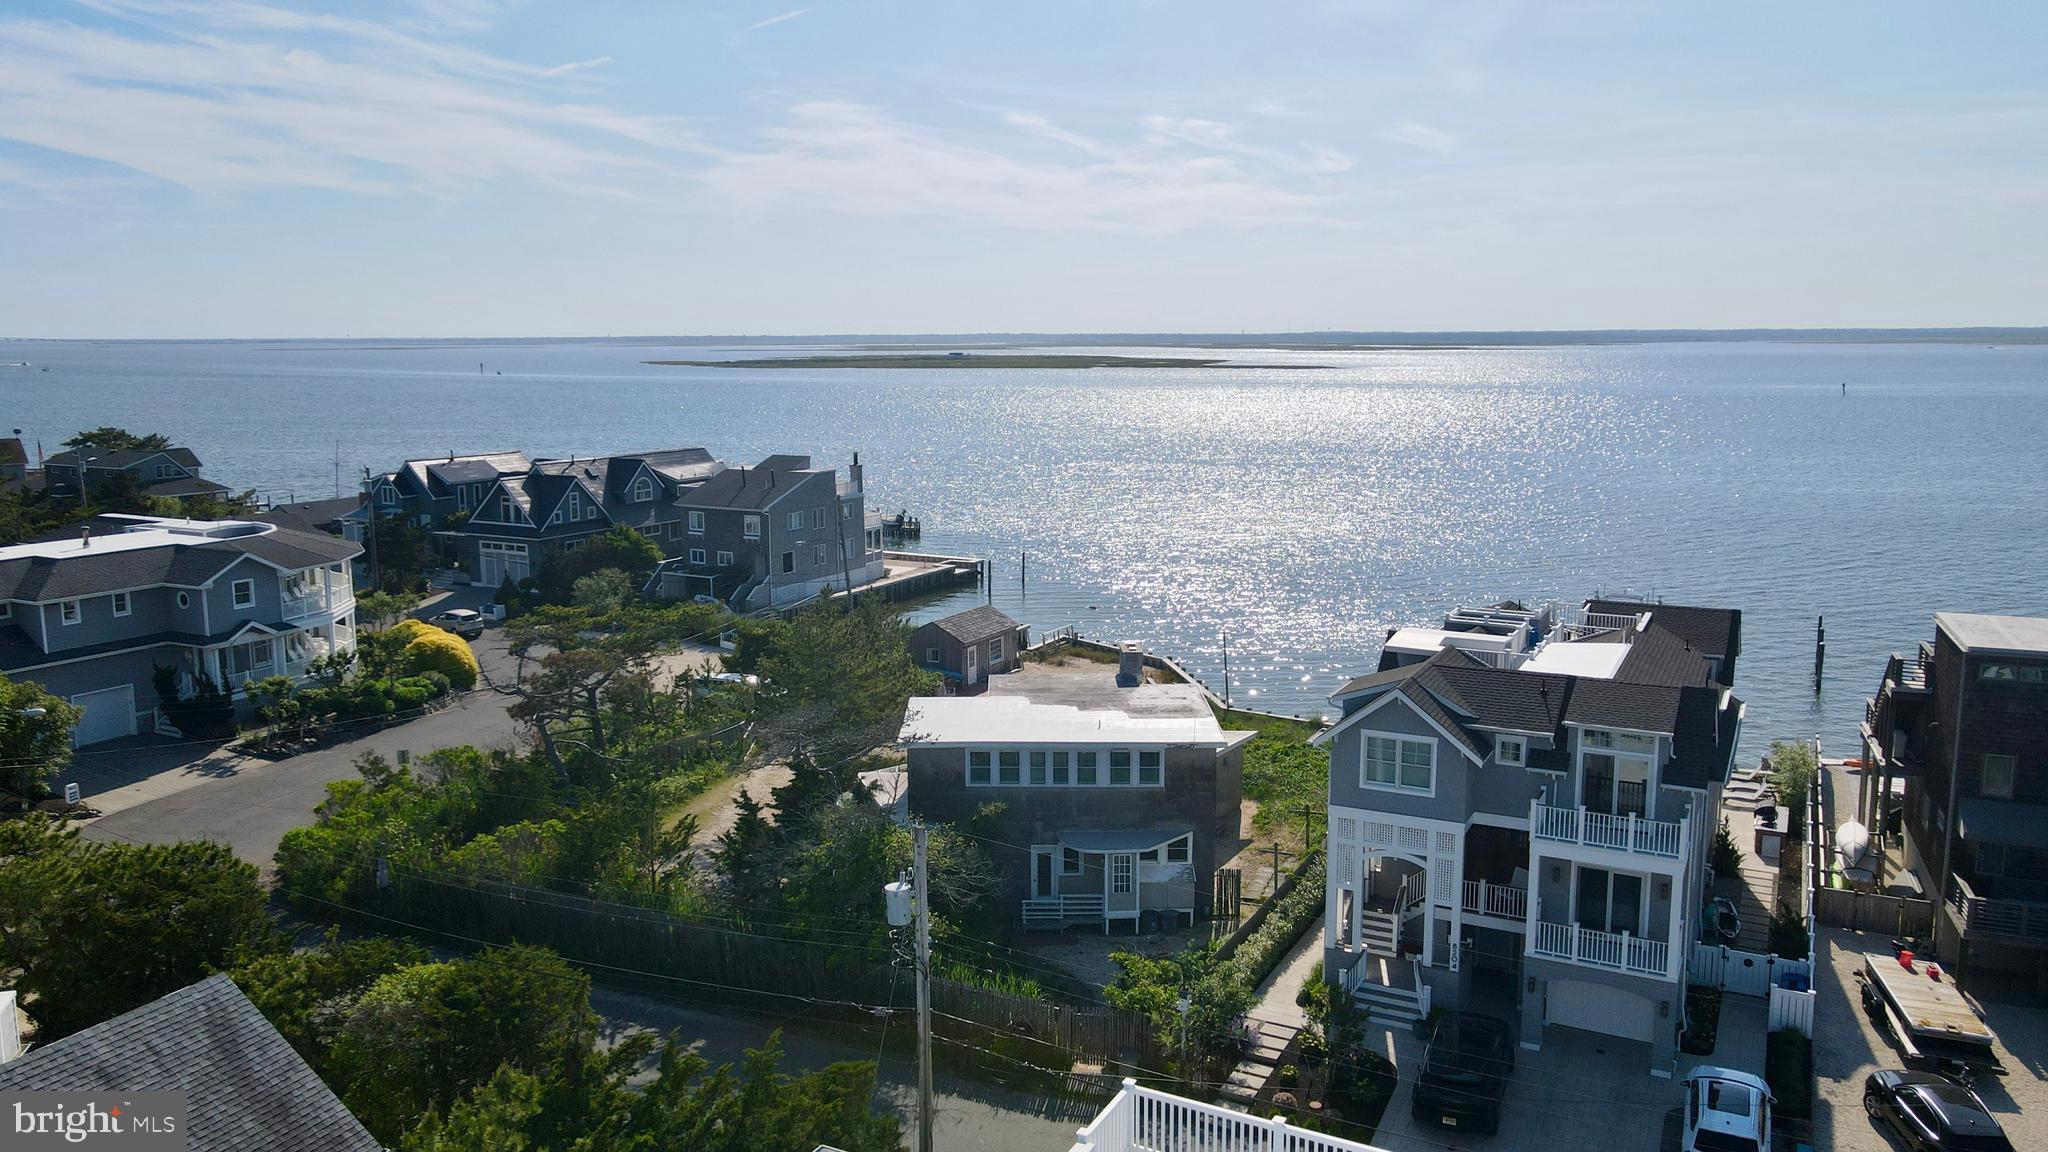
Ask three sources for the median home price in Harvey Cedars and you’ll get three different answers in the same month. In September 2025, Redfin recorded a median sale price of $1.5 million, down 52.6% from the year before, with homes taking a median of 89.5 days to sell. One brokerage’s own Harvey Cedars listings page put the median sale price at $3.1 million “last month,” down 11.4% year over year; the same brokerage’s luxury-listings page for the identical town put it at $1.5 million, up 48.1%.
By April 2026, Movoto had the median list price at $2.77 million, with homes moving in a median of 29 days. None of these numbers is wrong. They measure different things: closed sale price versus active list price, in different months, in a town where roughly a dozen or fewer homes typically trade hands in any given month. A single $8 million estate sale or a single $700,000 teardown lot can swing the median by hundreds of thousands of dollars. A county-wide tax dataset covering the shared 08008 zip code puts assessed-value medians closer to $984,000, which is a different measurement again, since assessed value routinely trails market value.
The one comparison genuinely worth having sits with neighboring towns, since they share the same island, storm exposure, and buyer pool:
| Town | Current average listing value | Notes |
|---|---|---|
| Harvey Cedars | $1.67M | Widest month-to-month swing of the group |
| Ship Bottom | $1.51M | Smaller lots, more year-round housing stock |
| Surf City | $1.63M | Mixed cottage and new-construction inventory |
| Barnegat Light | $1.65M | Northern tip of LBI, similar exposure profile |
| Long Beach Township | $2.06M | Largest township on the island by land area |
Source: Zillow, Harvey Cedars listings sidebar, retrieved July 2026. These are current average listing values, not median sale prices, so they aren’t directly comparable to the sale-price figures above. What they do confirm is relative positioning: Harvey Cedars prices in the middle of the northern-LBI cluster, not above it.
Who Actually Lives and Buys Here
Harvey Cedars is small by any measure. American Community Survey estimates put the resident population at roughly 487, with a median age around 63 and a median household income near $148,000, according to figures Census Reporter compiles from the ACS and aggregated separately from the same Census source. Owner-occupancy runs high and traditional year-round rental stock is thin.
For an investor weighing rental income, that composition matters more than the price tag: this isn’t a market built around long-term tenants. It’s a market of owner-occupiers and seasonal second-home buyers, which pushes rental strategy toward short-term summer leasing, and it means occupancy and rental comps should be pulled from short-term rental data, not from apartment-market sources.
Is Harvey Cedars a good rental-investment market? Better for short-term summer rentals than for a year-round landlord book: the small, high-owner-occupancy resident base limits long-term tenant demand, so the income case rests on peak-season pricing rather than 12-month occupancy.
Property Taxes: Lower Than New Jersey’s Reputation Suggests
New Jersey carries a reputation for the highest property taxes in the country, and statewide that reputation holds. Harvey Cedars is the exception, not the rule.
| Location | Effective tax rate | Median annual bill |
|---|---|---|
| Harvey Cedars | 0.97% | $9,361 |
| New Jersey (state median) | 2.82% | — |
| United States (national median) | 1.02% | $2,400 |
Source: Ownwell, Harvey Cedars property tax data. The dollar bill is high in absolute terms because home values are high, but the rate applied to that value sits below both benchmarks. High-value oceanfront towns like Harvey Cedars carry a large tax base relative to their tiny year-round population, which keeps the rate down even as the bill stays substantial.
Are Harvey Cedars property taxes high compared to the rest of New Jersey? The dollar amount is high because home values are high, but the effective rate, 0.97%, sits well below the state median of 2.82% and slightly below the national median of 1.02%.
Flood Risk and What FEMA Says About This Town
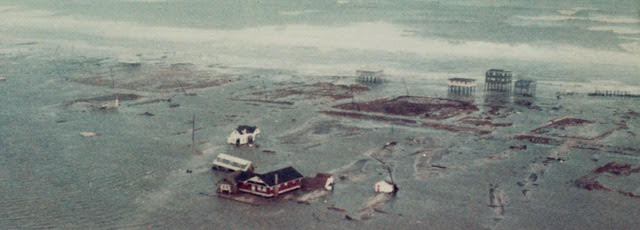
Every parcel in Harvey Cedars sits inside the 100-year floodplain and within a FEMA-designated Special Flood Hazard Area, according to the Borough’s own flood-awareness page, which states that a home in that designation carries a 26% chance of flood damage over the life of a 30-year mortgage. That figure isn’t a scare number; it’s the standard FEMA statistic for any Special Flood Hazard Area nationwide, and it applies here because the whole town qualifies.
Forward-looking data adds a second layer. First Street’s climate model, as surfaced through Redfin’s Harvey Cedars risk report, puts 89% of properties at severe flood risk over the next 30 years and rates the town’s overall flood exposure as extreme. Wind risk is rated severe for 100% of properties, driven mainly by hurricane exposure: a storm with today’s 1-in-3,000-year intensity currently produces gusts up to 128 mph, and the same-probability storm is projected to produce gusts up to 148 mph within 30 years. Heat risk is also rated severe for 100% of properties, with days above 95°F projected to rise from 7 a year today to 16 a year within three decades.
| Risk type | Current rating | 30-year projected change |
|---|---|---|
| Flood | 89% of properties, extreme town rating | Increasing faster than the national average |
| Wind (hurricane-driven) | 100% of properties, severe | Peak gusts rise from 128 mph to 148 mph |
| Heat | 100% of properties, severe | Days over 95°F rise from 7 to 16 per year |
Source: Redfin, via First Street’s Risk Factor model. For buyers weighing whether this is worse than “the Jersey Shore in general,” the Borough’s own materials point to a concrete historical marker: property owners are directed to review Superstorm Sandy-era flooding records, from 2012, at the Construction Office before purchasing, alongside the current preliminary flood maps.
Is Harvey Cedars a flood zone? The entire borough is inside a FEMA Special Flood Hazard Area and the 100-year floodplain, per the town’s own flood office, which puts the 30-year flood-damage probability at 26%.
Building or Renovating: The Elevation Rules
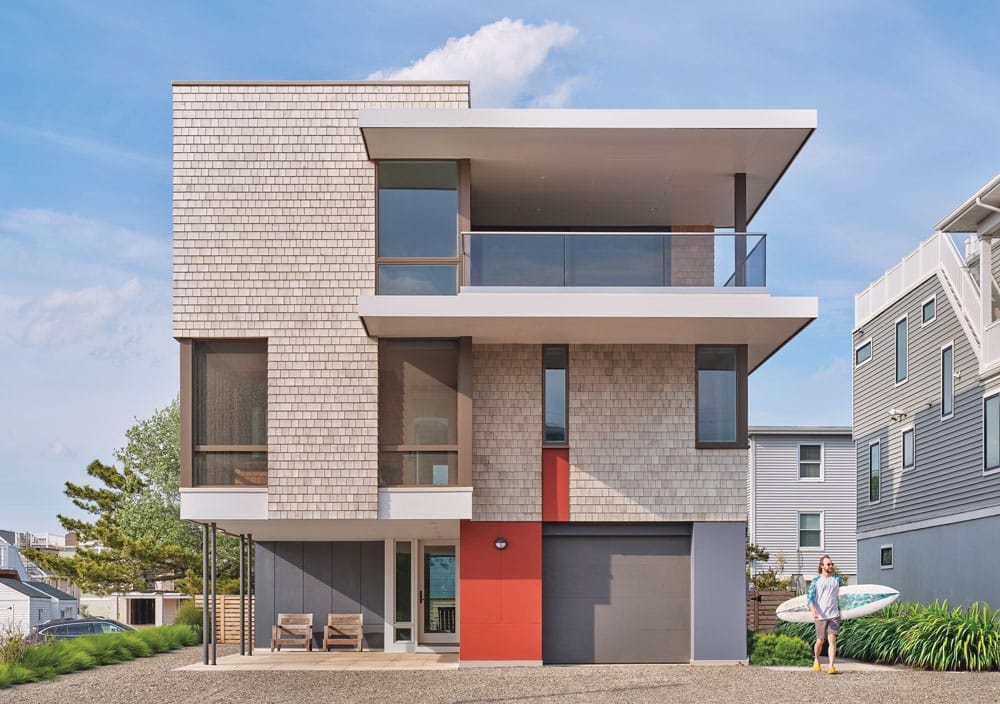
Harvey Cedars’ zoning code sets a specific, checkable construction standard that no brokerage blog quotes. For any residential structure on a lot adjacent to the beach-dune protective facility, Chapter 13, §13-7.9 of the Borough’s zoning ordinance requires the bottom of the first-floor joist to sit at a minimum of 16 feet above mean sea level, or 3 feet above the center-line elevation of the existing street grade, whichever is higher. That sits on top of New Jersey’s statewide 1-foot freeboard requirement above the FEMA base flood elevation.
If you’re filing a complete application before whichever deadline ends up final, the older, less restrictive standard still applies. If you’re planning to file after it, budget for the extra 4 feet of required elevation now.
How high does a new home have to be built in Harvey Cedars? On lots adjacent to the protective dune, the first-floor joist must sit at least 16 feet above mean sea level, or 3 feet above the street’s center-line grade, whichever is higher, on top of the state’s 1-foot freeboard rule; new construction filed after the REAL rule’s legacy window closes will need roughly 4 additional feet.
Buying Process, Compressed
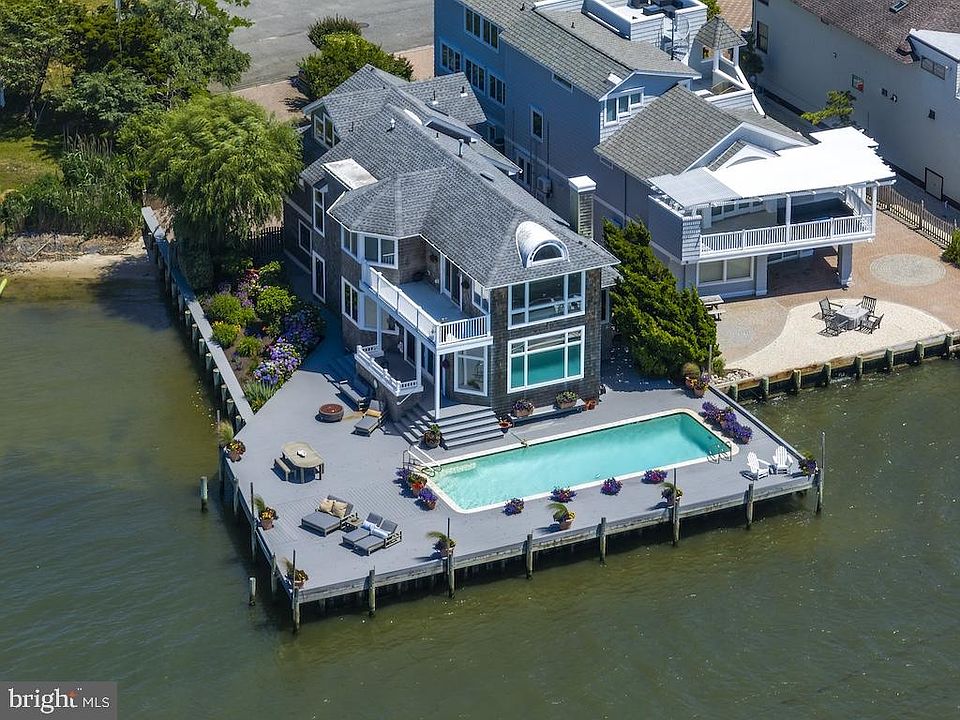
The mechanics of buying here don’t differ from buying anywhere else in New Jersey: pre-approval, an agent search, an offer, an inspection, an attorney review, and closing. What differs is what each step needs to check locally, covered above: flood zone, elevation compliance for anything you plan to alter, and which of the competing price figures actually describes the property you’re looking at.
For Agents Working This Market
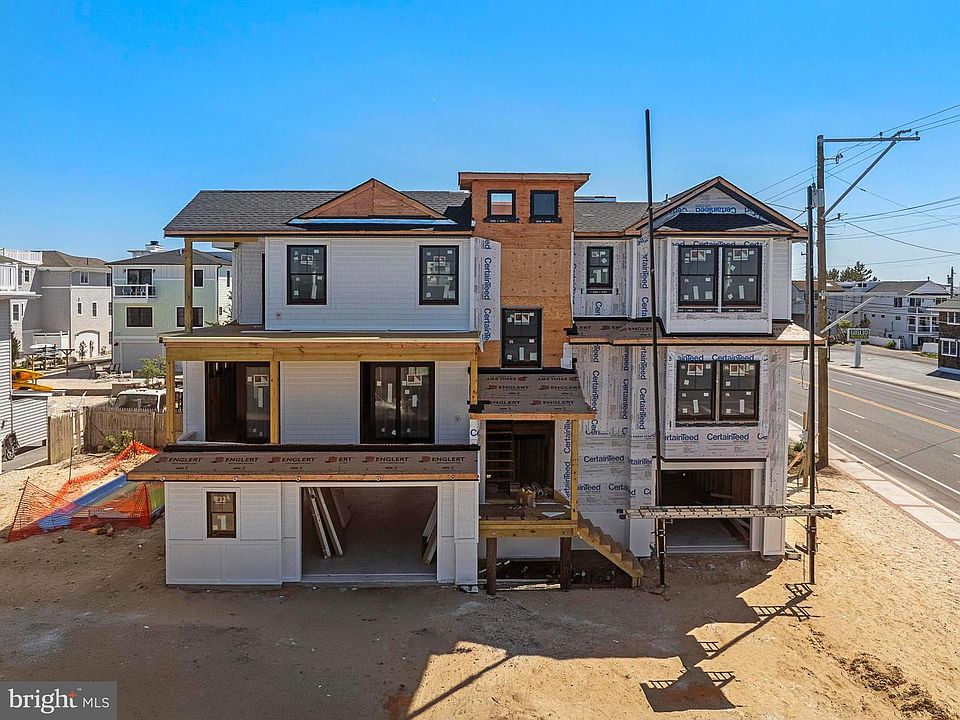
Long Beach Island listings, Harvey Cedars included, flow through the Bright MLS Internet Data Exchange via the New Jersey Multiple Listing Service, as disclosed on IDX pages carrying the island’s listings. Active MLS numbers on Harvey Cedars listings consistently follow an “NJOC” prefix, a pattern consistent with that coverage.
The practical challenge for agents here isn’t finding buyers; it’s that a market trading a handful of homes most months makes pricing guidance unusually sensitive to the last one or two closings. Pulling a 90-day or 12-month rolling median, rather than a single “last month” figure, gives sellers a materially more honest comparable set than the one-month snapshots most portal pages default to.
Common Mistakes and Misconceptions

- Assuming New Jersey’s tax reputation applies here. Harvey Cedars runs below both the state and national effective rate.
- Assuming an older cottage already meets current elevation code. Many pre-code homes don’t, which affects both insurability and resale value on any substantial renovation.
- Treating any single site’s median price as the real number. Check whether it’s a sale price, a list price, or an assessed value, and how many transactions it’s built on.
- Assuming the REAL rule’s 2027 date is final. As of mid-2026 it’s a proposed extension, not an adopted one.
Comments