
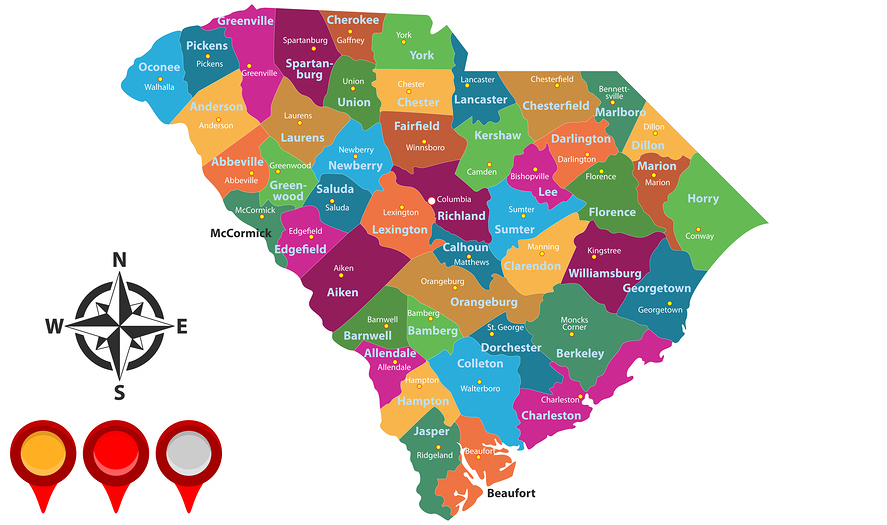
Four kinds of South Carolina county
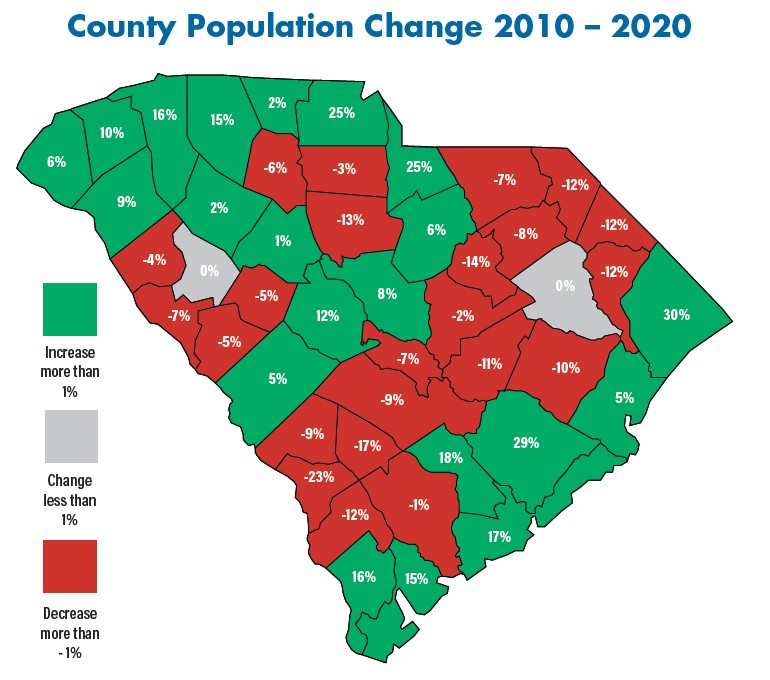
Treating all 46 counties as one alphabetical list hides the fact that they behave like four different real estate markets. A rental purchase in a county projected to add 200,000 residents by 2042 carries a different growth story than the same purchase in one of the 25 counties the state’s own projections show shrinking over that period, according to Post and Courier’s analysis of state Revenue and Fiscal Affairs Office projections. Grouping by use case, not spelling, makes that visible before a buyer commits to a search area.
Growth and metro corridor
Greenville, Spartanburg, York, Lancaster, Berkeley, Dorchester, Richland, Lexington, Aiken, and Anderson counties sit inside or adjacent to South Carolina’s largest metro areas. Horry County alone is projected to add 216,662 residents by 2042, a 53% increase, the single largest projected gain of any county in the state. Berkeley and Dorchester counties grew faster from 2023 to 2024 than Charleston County itself, the urban core they sit next to.
Coastal and tourism
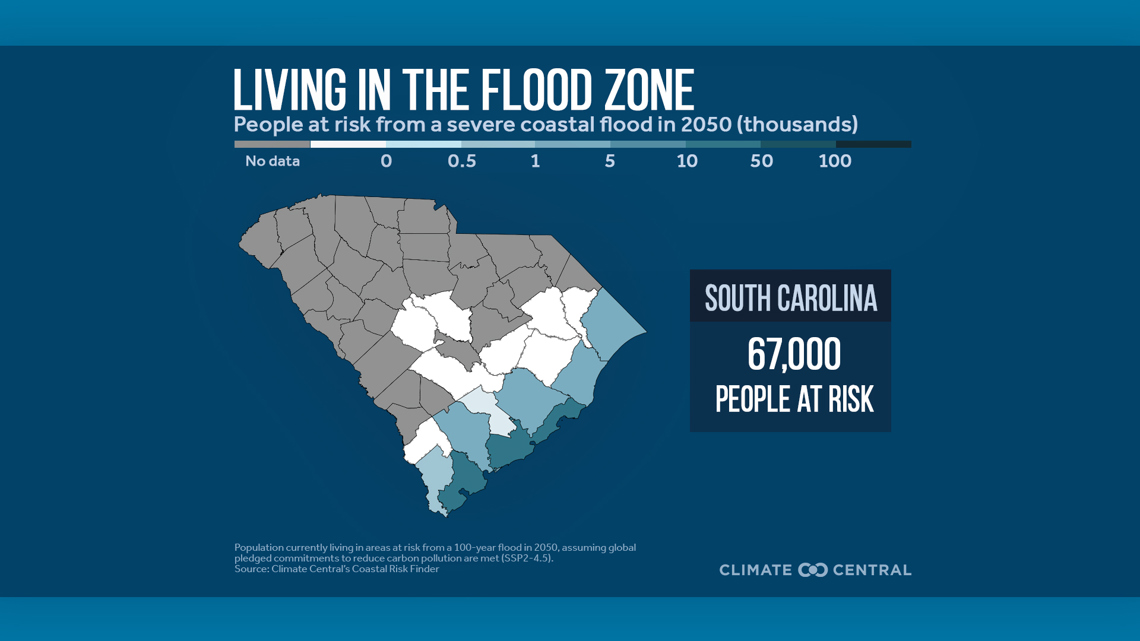
Horry, Georgetown, Charleston, Beaufort, Jasper, and Colleton counties carry the state’s tourism economy and its short-term rental market, along with its highest flood exposure. Jasper County’s population grew 6.0% from July 2024 to July 2025, the fastest rate of any county in the entire United States that year, per the SC Department of Employment and Workforce.
Rural and agricultural
Allendale, Bamberg, Barnwell, Calhoun, McCormick, Marlboro, Williamsburg, Lee, Clarendon, Hampton, Saluda, Chesterfield, Dillon, Marion, Fairfield, Abbeville, and Edgefield counties anchor South Carolina’s farmland and carry both the lowest land prices and the state’s population declines: Allendale County, the state’s least populous, has under 8,100 residents.
Small-town and county-seat
Oconee, Pickens, Cherokee, Union, Chester, Newberry, Laurens, Greenwood, Kershaw, Sumter, Darlington, Florence, and Orangeburg counties sit outside the fastest-growing corridors but still hold established county-seat economies, without the tourism-driven STR pressure of the coast.
| County | Seat | 2020 Census population | Land area (sq mi) | Cluster |
|---|---|---|---|---|
| Abbeville | Abbeville | 24,295 | 508 | Rural/agricultural |
| Aiken | Aiken | 168,808 | 1,073 | Growth/metro |
| Allendale | Allendale | 8,039 | 408 | Rural/agricultural |
| Anderson | Anderson | 203,718 | 718 | Growth/metro |
| Bamberg | Bamberg | 13,311 | 393 | Rural/agricultural |
| Barnwell | Barnwell | 20,589 | 548 | Rural/agricultural |
| Beaufort | Beaufort | 187,117 | 587 | Coastal/tourism |
| Berkeley | Moncks Corner | 229,861 | 1,098 | Growth/metro |
| Calhoun | St. Matthews | 14,119 | 380 | Rural/agricultural |
| Charleston | Charleston | 408,235 | 919 | Coastal/tourism |
| Cherokee | Gaffney | 56,216 | 393 | Small-town |
| Chester | Chester | 32,294 | 581 | Small-town |
| Chesterfield | Chesterfield | 43,273 | 799 | Rural/agricultural |
| Clarendon | Manning | 31,144 | 607 | Rural/agricultural |
| Colleton | Walterboro | 38,604 | 1,056 | Coastal/tourism |
| Darlington | Darlington | 62,905 | 561 | Small-town |
| Dillon | Dillon | 28,292 | 405 | Rural/agricultural |
| Dorchester | St. George | 161,540 | 575 | Growth/metro |
| Edgefield | Edgefield | 25,657 | 502 | Rural/agricultural |
| Fairfield | Winnsboro | 20,948 | 687 | Rural/agricultural |
| Florence | Florence | 137,059 | 800 | Small-town |
| Georgetown | Georgetown | 63,404 | 815 | Coastal/tourism |
| Greenville | Greenville | 525,534 | 790 | Growth/metro |
| Greenwood | Greenwood | 69,351 | 456 | Small-town |
| Hampton | Hampton | 18,561 | 560 | Rural/agricultural |
| Horry | Conway | 351,029 | 1,134 | Coastal/tourism |
| Jasper | Ridgeland | 28,791 | 656 | Coastal/tourism |
| Kershaw | Camden | 65,403 | 726 | Small-town |
| Lancaster | Lancaster | 96,016 | 549 | Growth/metro |
| Laurens | Laurens | 67,539 | 715 | Small-town |
| Lee | Bishopville | 16,531 | 410 | Rural/agricultural |
| Lexington | Lexington | 293,991 | 699 | Growth/metro |
| Marion | Marion | 29,183 | 489 | Rural/agricultural |
| Marlboro | Bennettsville | 26,667 | 480 | Rural/agricultural |
| McCormick | McCormick | 9,526 | 360 | Rural/agricultural |
| Newberry | Newberry | 37,719 | 631 | Small-town |
| Oconee | Walhalla | 78,607 | 625 | Small-town |
| Orangeburg | Orangeburg | 84,223 | 1,106 | Small-town |
| Pickens | Pickens | 131,404 | 497 | Small-town |
| Richland | Columbia | 416,147 | 756 | Growth/metro |
| Saluda | Saluda | 18,862 | 452 | Rural/agricultural |
| Spartanburg | Spartanburg | 327,997 | 811 | Growth/metro |
| Sumter | Sumter | 105,556 | 665 | Small-town |
| Union | Union | 27,244 | 514 | Small-town |
| Williamsburg | Kingstree | 31,026 | 934 | Rural/agricultural |
| York | York | 282,090 | 682 | Growth/metro |
Twenty-one of the 46 counties fall into the growth/metro or coastal/tourism clusters; the remaining 25 are exactly the counties the state’s own long-range projections show losing population by 2042.
Which South Carolina counties are growing fastest?Jasper County led the entire United States in county population growth from July 2024 to July 2025, at 6.0%. Berkeley (3.3%) and Horry (3.2%) also ranked in the national top 40. Horry County has the largest projected numeric gain by 2042, at 216,662 residents.
Property tax: the 4% vs. 6% rule
South Carolina assesses real estate at two different ratios depending on use, not location: 4% of fair market value for a property the owner occupies as a legal primary residence, and 6% for a second home, rental, or other investment property, under Article X of the state constitution and SC Department of Revenue’s property tax manual. Owner-occupied homes also skip the school-operating-tax portion of the millage rate, a separate benefit under SC Act 388. Combined, the two effects mean a rental property’s tax bill can run roughly three and a half times higher than an identical owner-occupied home in the same tax district, per a Lincoln Institute of Land Policy study cited by the Palmetto Promise Institute. The 4% rate is not automatic: an owner must file a legal-residence application with the county assessor.
Owner-occupied vs. investment property
The assessment ratio sets the taxable share of value; the county’s millage rate then sets the actual bill. Effective rates, meaning tax paid as a share of home value, already vary by county even before the ratio shift is applied:
| County | Average effective property tax rate | Note |
|---|---|---|
| Horry | 0.33% | Lowest in the state |
| Lexington | 0.43% | Below the Richland County rate next door |
| York | 0.46% | Close to the state average |
| South Carolina (state average) | 0.45% | Owner-occupied basis |
| Spartanburg | 0.52% | Above the state average |
| Richland | 0.59% | Highest of the counties listed here |
These are owner-occupied effective rates from SmartAsset’s analysis of county tax data; an investment property in the same county pays a higher effective rate again, since it carries the 6% ratio and loses the school-operating exemption on top of it. Rate data for the remaining 40 counties was not independently verifiable from a public source with a stated methodology at the time of writing; buyers evaluating a county outside this table should request the current millage sheet from that county’s auditor rather than rely on a third-party estimate.
Is property tax higher for investment property than a primary residence in South Carolina?Yes. Investment property is assessed at 6% of value instead of 4%, and it does not qualify for the school-operating-tax exemption that owner-occupied homes receive, which combined can push the tax bill several times higher on an identical property.
Local-option and accommodations sales tax
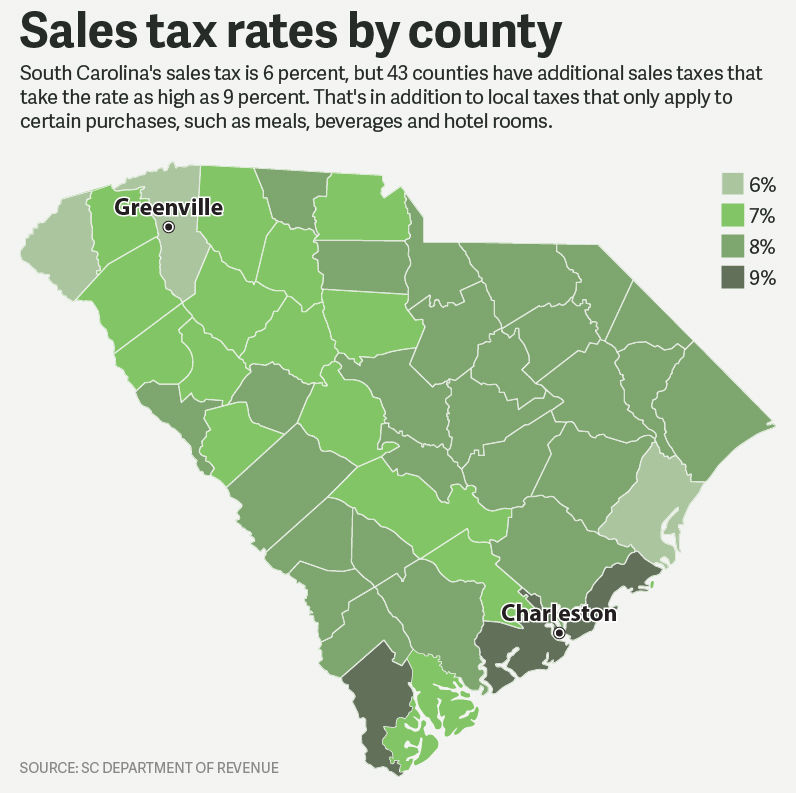
Thirty-two of South Carolina’s 46 counties have adopted the Local Option Sales Tax, a voter-approved 1% add-on used to reduce property tax bills, according to Georgetown County’s own LOST page. The remaining counties, including several coastal ones, have not. On top of that, short-term rentals carry a separate layer: a 2% statewide accommodations tax plus a local accommodations tax that varies by municipality, on top of whatever sales tax applies.
Does every South Carolina county charge the same sales tax?No. The state rate is 6% everywhere, but 32 of 46 counties add a 1% Local Option Sales Tax on top of it, and some municipalities layer on capital-project or transportation taxes beyond that.
Short-term rental rules by county

Short-term rental legality in South Carolina is set locally, and the coastal counties where investors want to buy are exactly where the rules are tightest and changing fastest. Beaufort City council voted unanimously on April 28, 2026, to cap short-term rentals at 4% of allowable residential parcels citywide and 3% within its National Historic Landmark District, with a $100 application fee, mandatory 300-foot spacing between rentals, and a three-strike enforcement policy carrying a $1,000 fine for an unpermitted rental, per the Island News. The historic district alone held 91 short-term rentals when the ordinance passed, against a new cap of roughly 30.
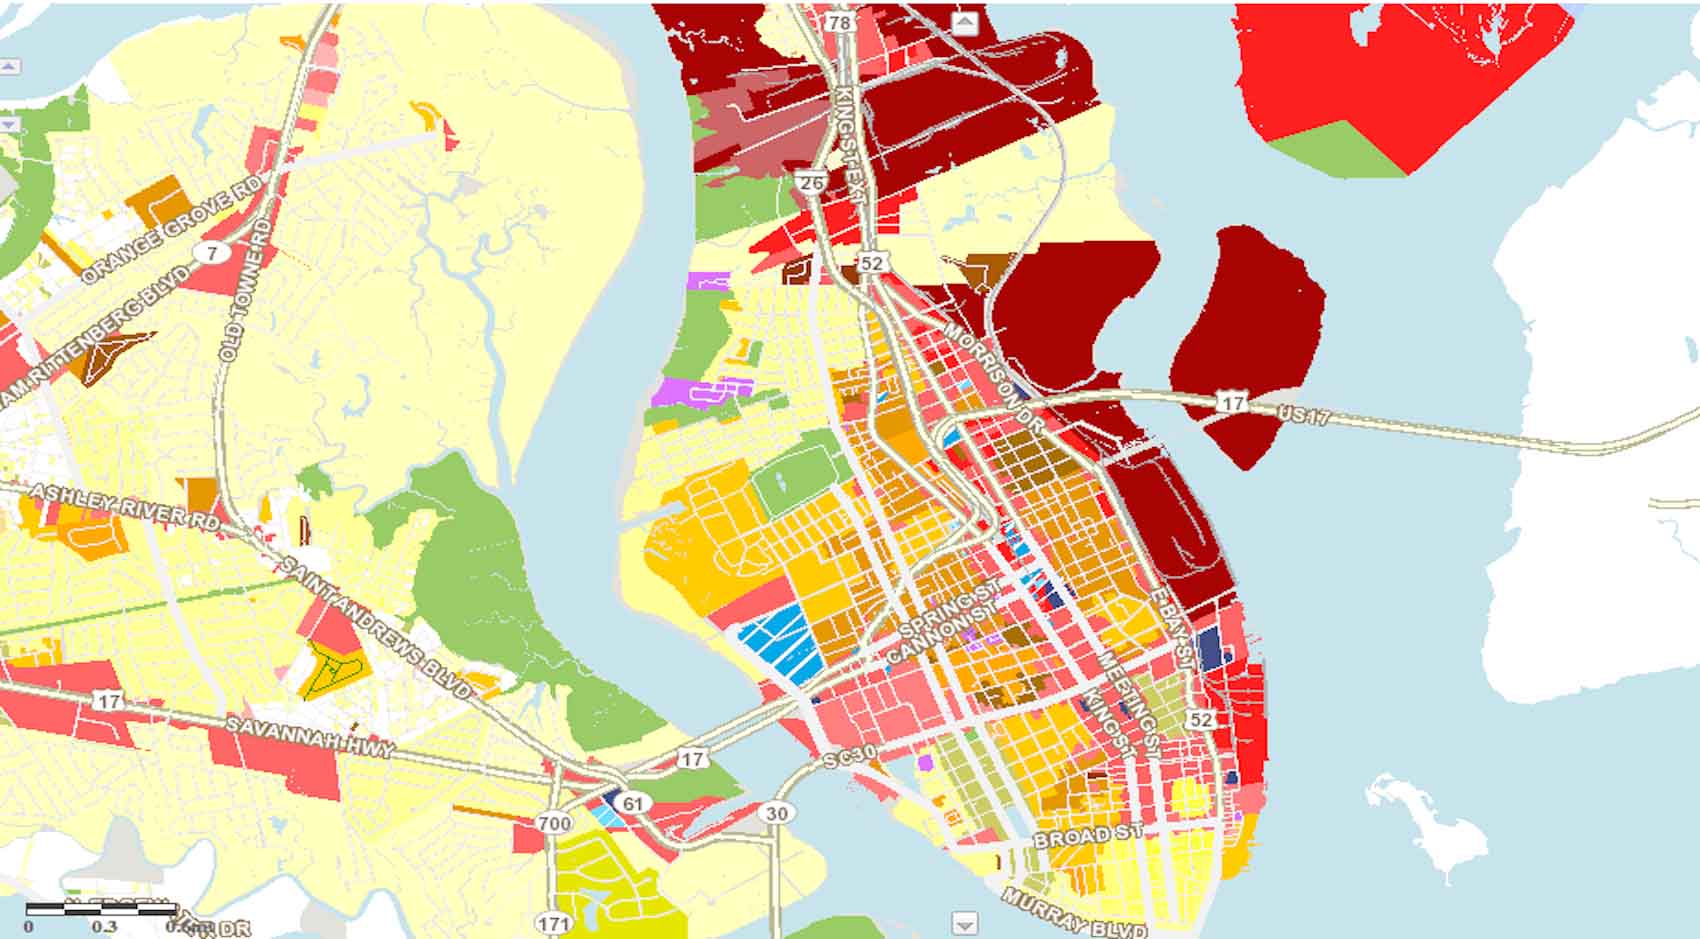
Charleston limits short-term rentals within its historic peninsula through a capped permit system with a waitlist and requires 150-foot spacing between rentals in residential zones. Unincorporated Lexington County, far from the coast, still requires its own zoning permit for any short-term rental as of January 1, 2025, including a septic inspection report and a parking plan. Horry County, the state’s busiest tourism market by volume, has no countywide STR cap; regulation there runs through individual HOA covenants and municipal zoning instead.
| Jurisdiction | STR rule | Effective |
|---|---|---|
| City of Beaufort (citywide) | 4% of residential parcels, one STR per parcel, 300-ft spacing | April 28, 2026 |
| City of Beaufort (Historic Landmark District) | 3% of allowable parcels | April 28, 2026 |
| City of Charleston (historic peninsula) | Capped permits, waitlist system, 150-ft spacing citywide in residential zones | Ongoing, under active revision |
| Unincorporated Lexington County | Zoning permit required, annual renewal, septic and parking plan | January 1, 2025 |
| Horry County (unincorporated/countywide) | No county-imposed cap; governed by municipal zoning and HOA rules | Not applicable |
The direction of travel matters more than any single figure here: Beaufort’s cap followed a documented 42% jump in STRs since 2022, and Charleston County was separately moving in February 2026 to close enforcement gaps against unpermitted listings identified through new monitoring software.
Which South Carolina counties restrict short-term rentals?Beaufort’s city limits carry the strictest documented caps in the state (3% to 4% of parcels). Charleston caps permits within its historic peninsula and enforces spacing rules citywide. Lexington County regulates STRs countywide even though it is not coastal. Horry County has no countywide cap.
Flood and insurance exposure by region
The average NFIP flood insurance premium in South Carolina is projected to reach about $1,351 a year as Risk Rating 2.0 phases in fully, up from a lower pre-2022 baseline, per Clovered’s analysis of NFIP rate data. Charleston’s average premium is rising from $852 to $1,575 under the same phase-in. Nearly 150,000 properties across Horry, Georgetown, Charleston, and Beaufort counties face major, severe, or extreme flood risk over the next 30 years, while only about 100,000 properties in those same four counties sit in zones that trigger a mortgage lender’s flood-insurance requirement.
Community Rating System discounts soften the blow unevenly: Charleston County communities qualify for a 40% NFIP discount, while Horry and Beaufort communities qualify for 25%. None of these discounts apply to private flood policies. Between 2024 and 2025, Charleston and Horry counties each lost nearly 1,300 NFIP policies, and Beaufort County lost about 950, as some owners dropped coverage rather than absorb the increase.
Which South Carolina counties have the highest flood insurance costs?Charleston and Georgetown carry the highest documented average premiums among South Carolina’s coastal counties, both trending above the state average of roughly $1,351 a year as Risk Rating 2.0 phases in.
Sourcing note
Population and land-area figures in the main table come from a single source, the SC Association of Counties’ 2020 Census county profile table, chosen because it states its Census vintage explicitly and matches the Census Bureau’s own gazetteer figures. Other public sources quote different numbers for the same counties without stating a vintage. Greenville County’s population, for example, appears as 525,534 in the 2020 Census table used here, but as high as 583,125 or 611,336 in other online aggregators that do not state their methodology or date.
The Greenville County population discrepancy above is real and unresolved in casual sources: figures ranging from roughly 525,500 to over 611,000 circulate for the same county depending on vintage and estimation method. This page uses the 2020 Census figure because it is the only one with a stated, checkable source; readers who need a current estimate should pull it directly from the Census Bureau’s county population estimates page rather than trust either figure quoted secondhand.County-level average effective tax rates and millage sheets change annually and are set by each county auditor, not by this page.
Comments