
The Full List of Utah’s Counties
The table below covers all 29 counties, their seats, and where each stood as of the most recent state population estimate.
| County | Seat | Population (July 2025) | 1-yr growth |
|---|---|---|---|
| Beaver | Beaver | 7,429 | 1.2% |
| Box Elder | Brigham City | 62,911 | 1.9% |
| Cache | Logan | 145,865 | 1.7% |
| Carbon | Price | 20,539 | 0.5% |
| Daggett | Manila | 959 | -2.4% |
| Davis | Farmington | 381,339 | 0.7% |
| Duchesne | Duchesne | 20,266 | 0.5% |
| Emery | Castle Dale | 9,922 | 0.1% |
| Garfield | Panguitch | 5,074 | -0.8% |
| Grand | Moab | 10,105 | 2.1% |
| Iron | Parowan | 69,939 | 3.0% |
| Juab | Nephi | 13,364 | 1.9% |
| Kane | Kanab | 8,481 | 1.4% |
| Millard | Fillmore | 13,715 | 0.8% |
| Morgan | Morgan | 13,341 | 1.9% |
| Piute | Junction | 1,625 | -1.5% |
| Rich | Randolph | 2,812 | 0.3% |
| Salt Lake | Salt Lake City | 1,240,937 | 0.7% |
| San Juan | Monticello | 14,998 | 0.0% |
| Sanpete | Manti | 31,454 | 1.8% |
| Sevier | Richfield | 22,118 | 0.7% |
| Summit | Coalville | 43,303 | 0.0% |
| Tooele | Tooele | 84,320 | 3.0% |
| Uintah | Vernal | 36,634 | 1.2% |
| Utah | Provo | 765,515 | 2.1% |
| Wasatch | Heber City | 39,588 | 2.0% |
| Washington | St. George | 209,129 | 2.3% |
| Wayne | Loa | 2,538 | -0.2% |
| Weber | Ogden | 272,929 | 0.6% |
Source: Kem C. Gardner Policy Institute, Utah Population Committee estimates, July 1, 2025. That table already answers the lookup question a “list of counties” search exists for. What it can’t show on its own is which of these numbers should change a decision, which is what the rest of this page covers.
Which Utah counties are growing fastest right now? Tooele and Iron counties led the state at 3.0% growth between mid-2024 and mid-2025. Washington (2.3%), Utah and Grand (2.1% each), and Wasatch (2.0%) also grew faster than the state average of 1.3%. Five counties shrank: Daggett, Piute, Garfield, Wayne, and San Juan.
County Government: Three Models, Not One
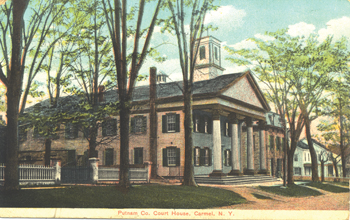
Utah counties don’t all run the same way. State law lets each county choose among a standard three-member commission, a larger five- or seven-member expanded commission, or a council paired with either an elected full-time mayor or an appointed manager (Utah Code, Title 17, Chapter 52a, Part 2). Salt Lake County is the clearest example of the alternative: it operates under a nine-member council with an elected mayor rather than the three-member commission most rural counties still use. The difference matters for anyone dealing with a county directly, because a council-mayor structure separates legislative and executive authority the way a city government does, while a commission fuses both roles into the same three people who also sit as the board that hears zoning appeals.
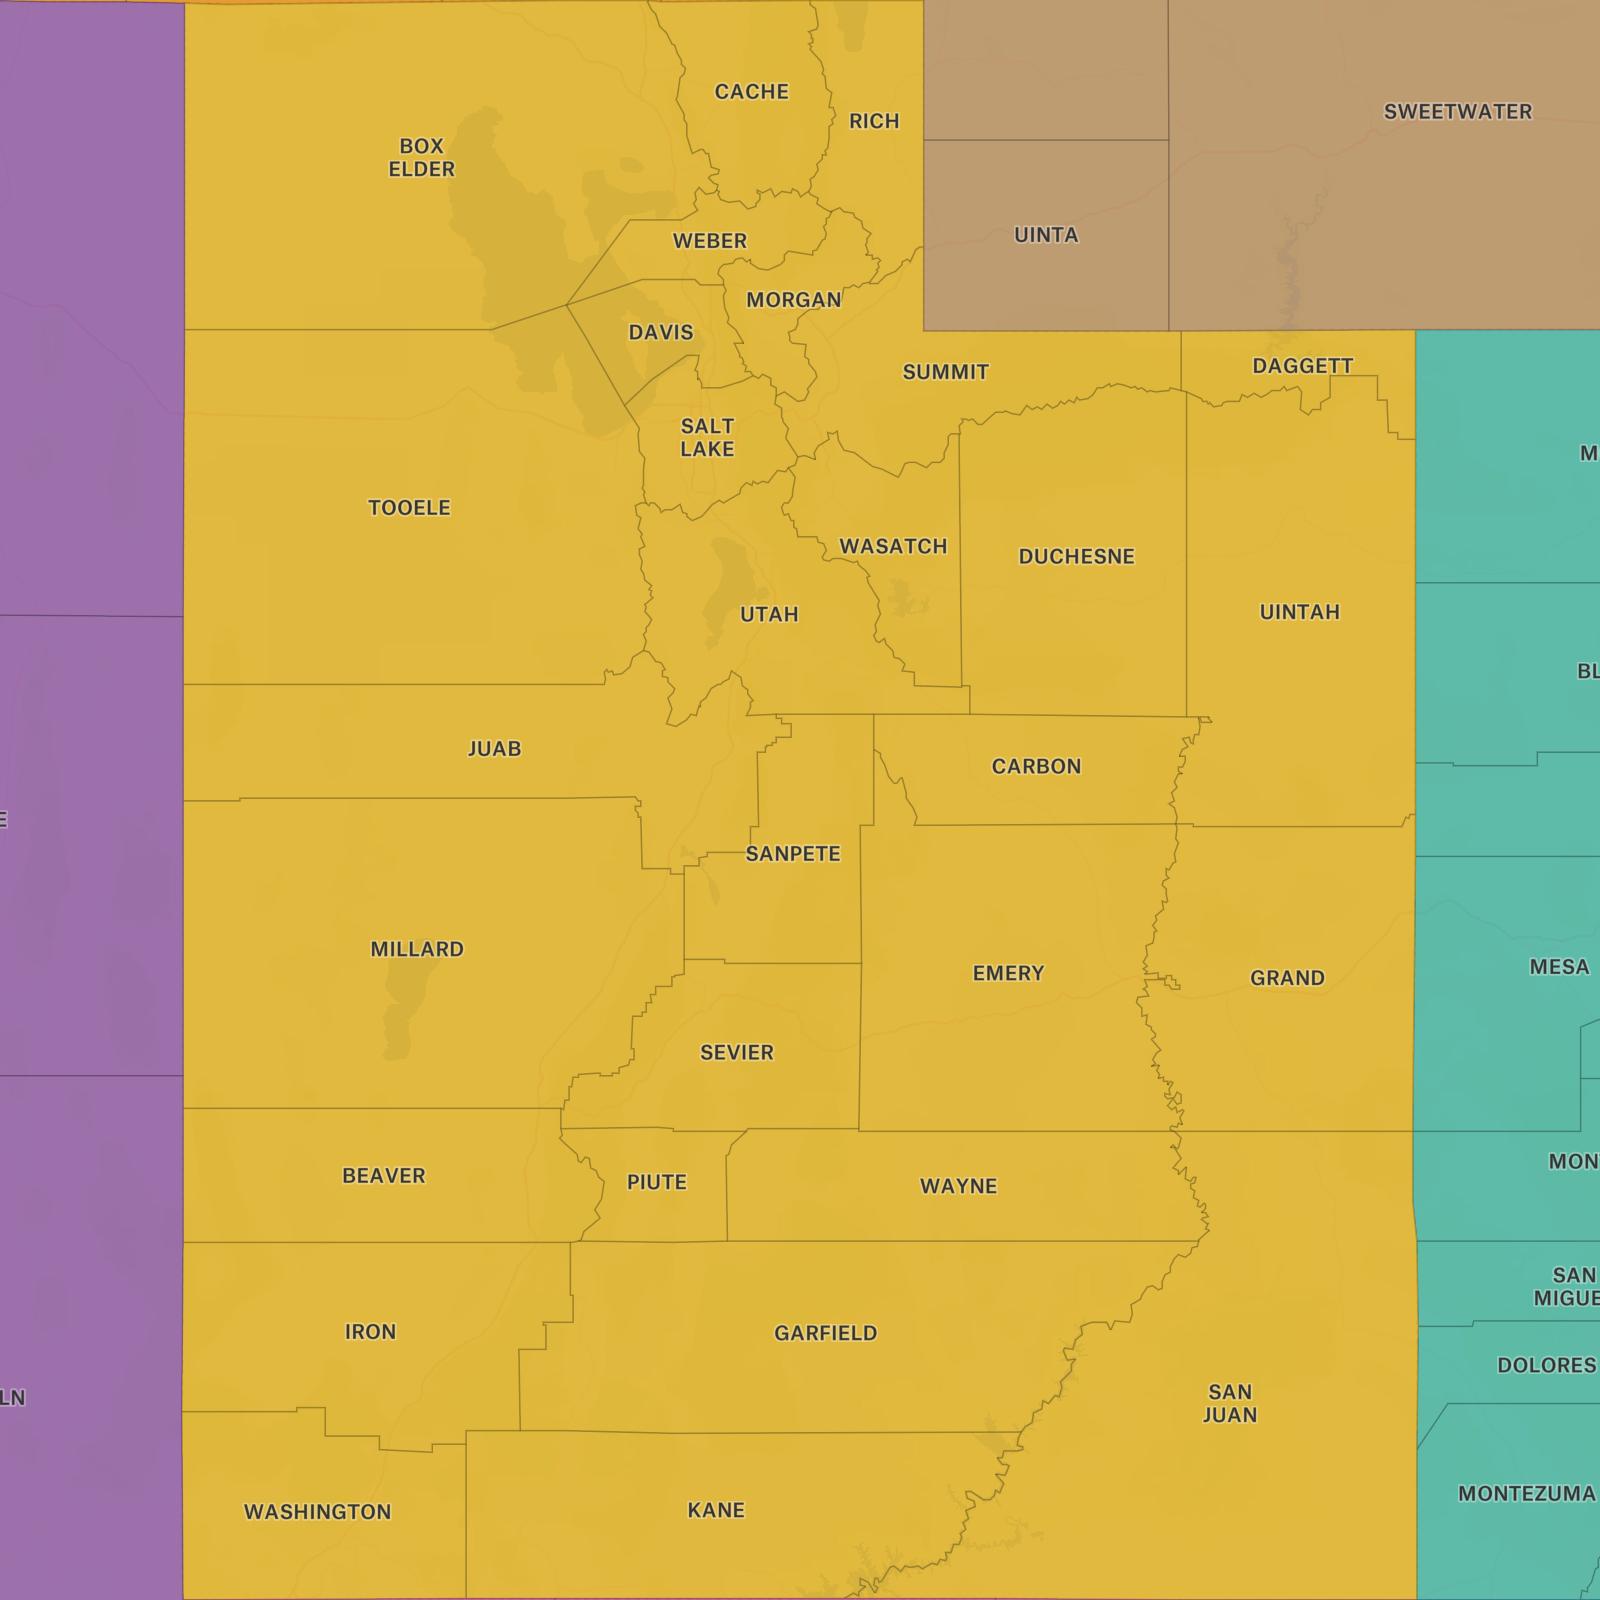
Utah counties also carry an unusual degree of legal flexibility. Under State v. Hutchinson (1980), Utah’s counties operate under what the National Association of Counties calls “Hutchinson’s Rule”: counties may legislate on any subject the state hasn’t already occupied, a broader grant of authority than the strict Dillon’s Rule model used in most states (NACo, Utah: County Government Overview). In practice, county-level ordinances on land use, business licensing, or nuisance regulation can vary more between Utah counties than in states where counties are limited to whatever the legislature explicitly authorizes.
State law also divides counties into six population classes, from Salt Lake as the sole first-class county (1,000,000 or more residents) down to a sixth class below 4,000 (Utah Code § 17-50-501). The classification determines which statutes apply to a given county’s budget authority, fee schedules, and staffing requirements, so a fourth-class county – a bracket that includes Wasatch and Summit – operates under different statutory defaults than Salt Lake’s first-class rules.
Does a county’s government type affect how fast I can get a building permit? Not directly through state law, but indirectly through structure: a council-manager or council-mayor county centralizes day-to-day permitting decisions in one executive office, while a three-member commission county typically routes the same decisions through commission meetings and agenda cycles, which can add scheduling lag for anything requiring a public hearing.
Property Taxes by County
None of the standard county-list pages cover property tax at all, despite it being one of the first numbers a buyer or investor needs. Rates vary by county and by the mix of school district, water district, and municipal levies layered on top of the base county rate.
| County | Effective tax rate | Median annual bill |
|---|---|---|
| Salt Lake | 0.51% | Not separately reported |
| Davis | 0.48% | about $2,726 |
| Summit | 0.39% | $1,921 (highest in state) |
| Rich | 0.35% | $422 (lowest in state) |
Sources: SmartAsset (Salt Lake, Davis, citing Census data) and Tax-Rates.org (Summit, Rich). Summit County pays the highest dollar amount in property tax in Utah despite one of the lower effective rates in the state, because its home values are high enough that even a below-average rate produces the largest bill. Rich County shows the opposite: a low rate applied to low home values produces the smallest bill in the state.
Which Utah county has the highest property taxes? Summit County residents pay the highest median annual property tax bill in the state, about $1,921, even though its effective rate (0.39%) is below several urban counties. Rich County has the lowest median bill, about $422.
Home Values by County: A Different Map Than Population
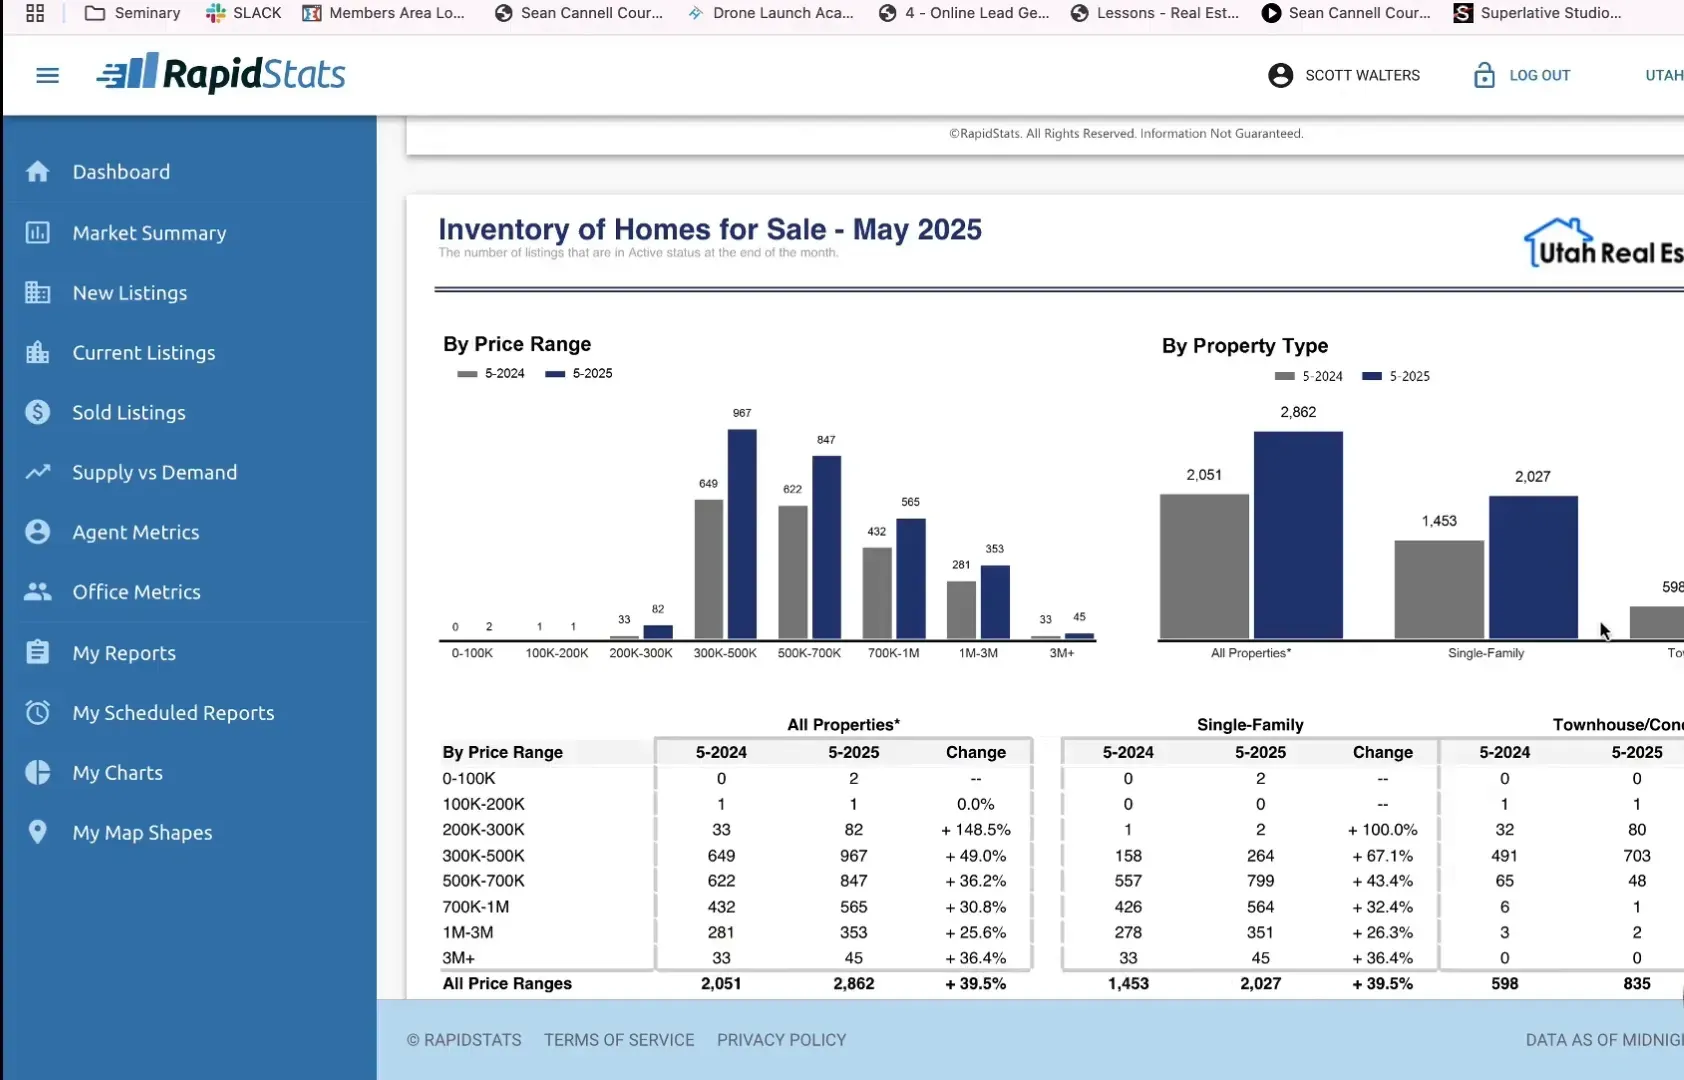
Utah’s most populous counties are not its most expensive. The Gardner Institute’s July 2025 housing report broke down 2024 median single-family sale prices by county, and resort and mountain counties top the list ahead of Salt Lake County itself.
| Priciest counties (2024 median sale price) | Cheapest counties |
|---|---|
| Summit – $1,635,000 | Carbon – $250,000 |
| Wasatch – $992,750 | Emery – $272,000 |
| Morgan – $772,000 | Millard – $311,450 |
| Rich – $637,000 | Duchesne – $315,000 |
| Salt Lake – $610,000 | San Juan – $329,000 |
Source: Kem C. Gardner Policy Institute, State of the State’s Housing Market, July 2025, as reported by KSL. Statewide median: $564,000. Rich County appears on both extremes on this page: the lowest property tax bill and one of the highest home prices. That isn’t a contradiction – its low effective rate applies to a small, high-value housing stock concentrated around Bear Lake, producing a modest total tax collection even as individual homes carry seven-figure valuations in places.
Unincorporated Land and Zoning
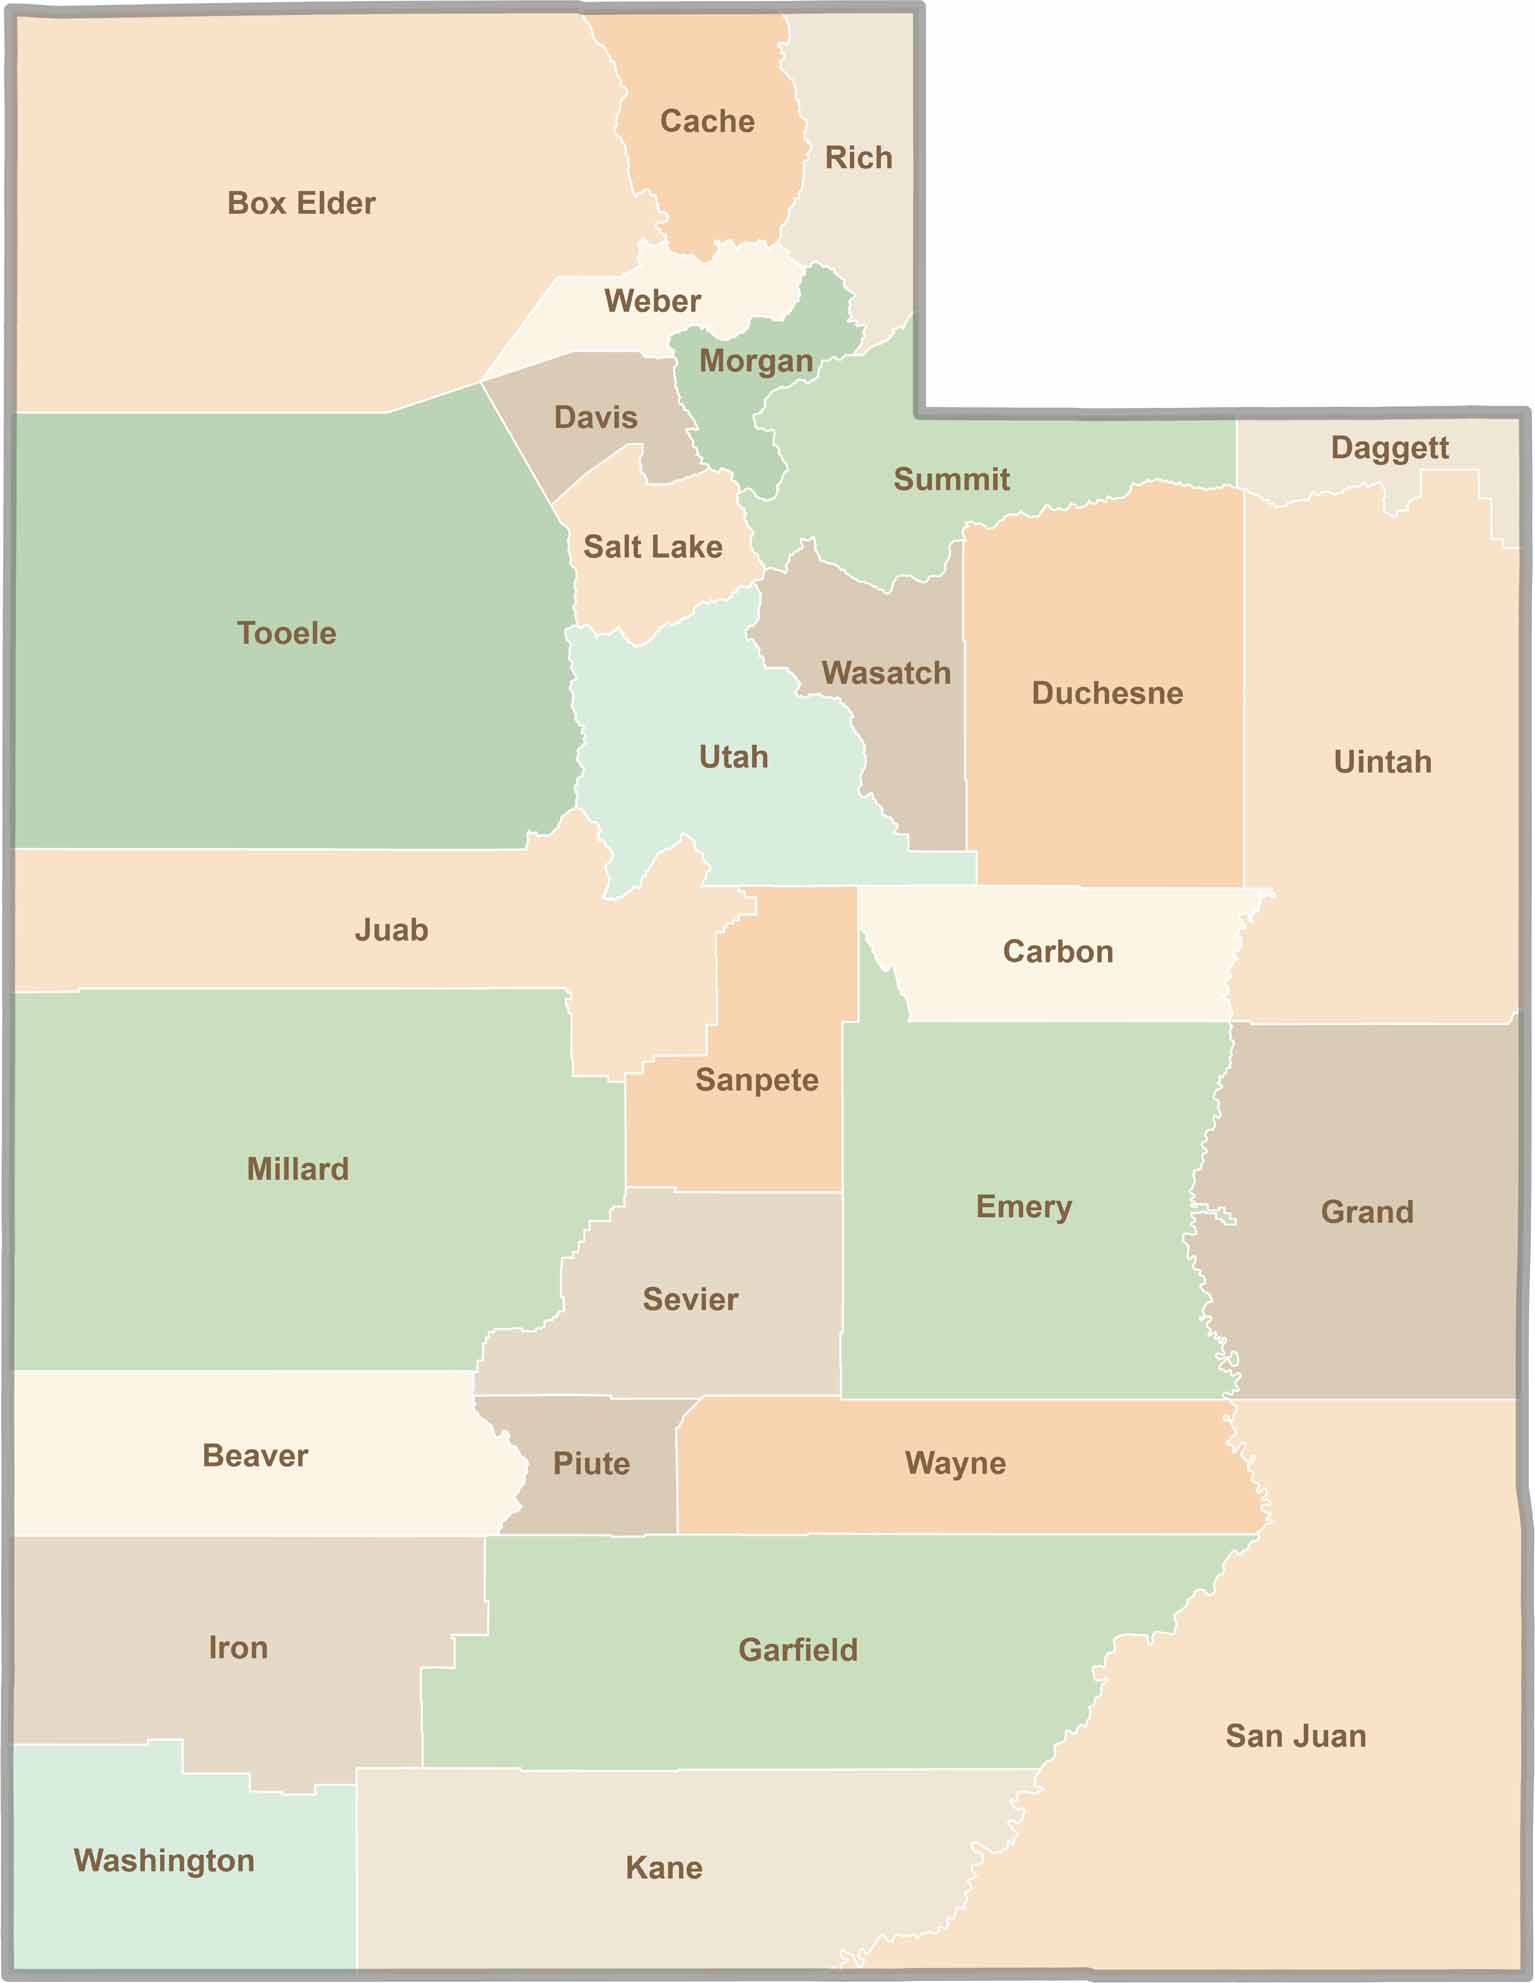
A meaningful share of Utah’s land, especially in Summit, Wasatch, and the rural southern counties, sits outside any city or town boundary. Zoning and permitting authority for that land runs through the county planning department directly, and the rules that apply can differ from the zoning code of the nearest incorporated city with the same name.
Which Counties Have Opportunity Zone Designations
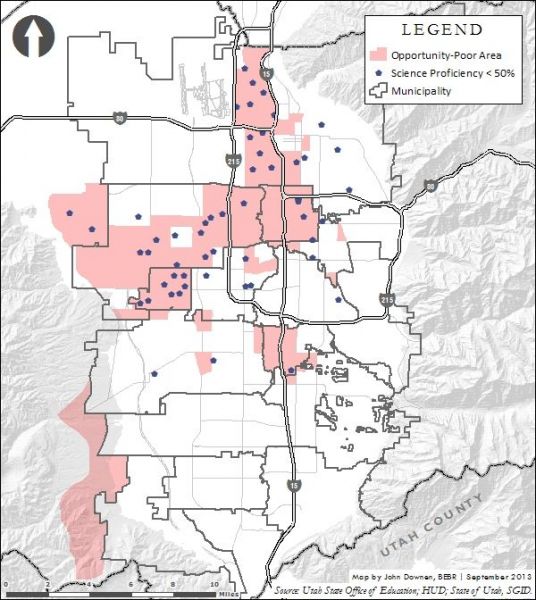
Grand County’s Census Tract 49019000300, covering the Moab area, is a federally designated Opportunity Zone, according to Grand County’s government website. Investors who reinvest capital gains into a Qualified Opportunity Fund tied to that tract can defer or reduce tax on those gains under the federal program. Utah’s Governor’s Office of Economic Opportunity notes that the 2025 tax law changes narrowed the criteria for new designations statewide, with the next designation round expected in 2026 (business.utah.gov).
Are there Utah counties with Opportunity Zone tax incentives? Yes. Grand County’s Moab-area census tract is one confirmed example; other rural and urban tracts across the state carry the same designation, and a new round of designations is expected in 2026 under revised federal criteria.
Common Mistakes When Comparing Utah Counties
Confusing county and city boundaries
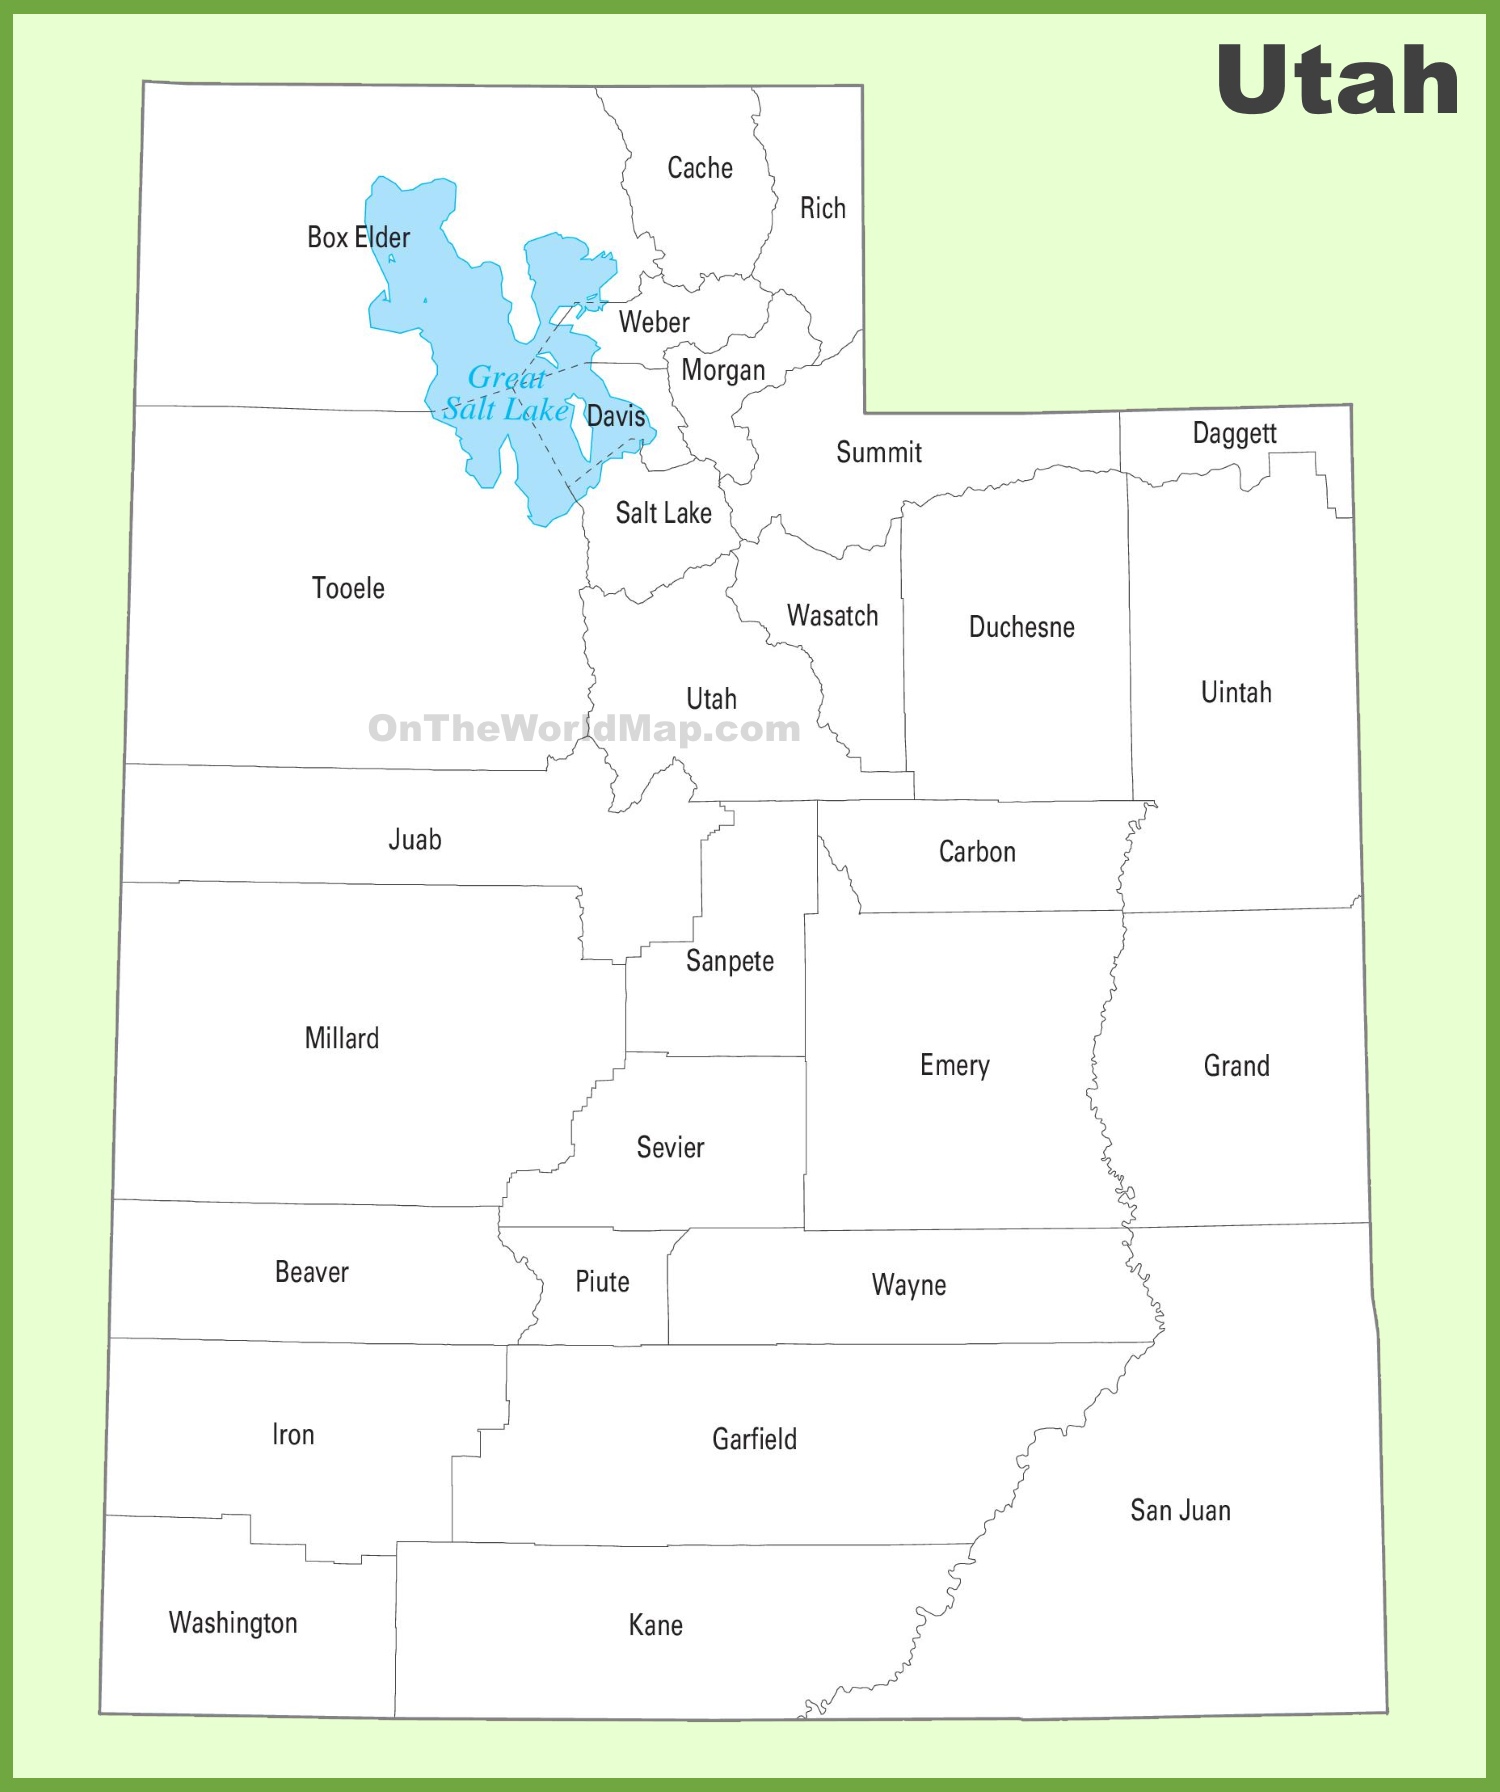
A city can straddle two counties, and its zoning code answers to the municipality, not the surrounding county, for any parcel inside city limits.
Assuming urban tax and service patterns apply statewide
Salt Lake County’s tax rate and service level don’t transfer to a sixth-class county with a fraction of the tax base.
Treating population size as a growth signal
A county’s total population and its growth rate answer different questions, and the two rankings on this page don’t match: several smaller counties outpaced every large county in percentage growth over the past year.
Comments