
What Bucks County homes actually cost, right now, by area
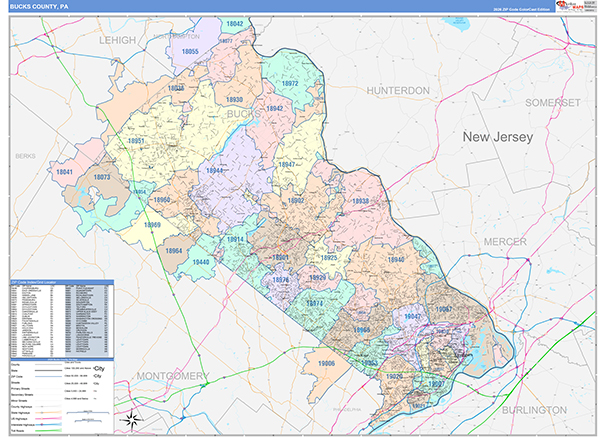
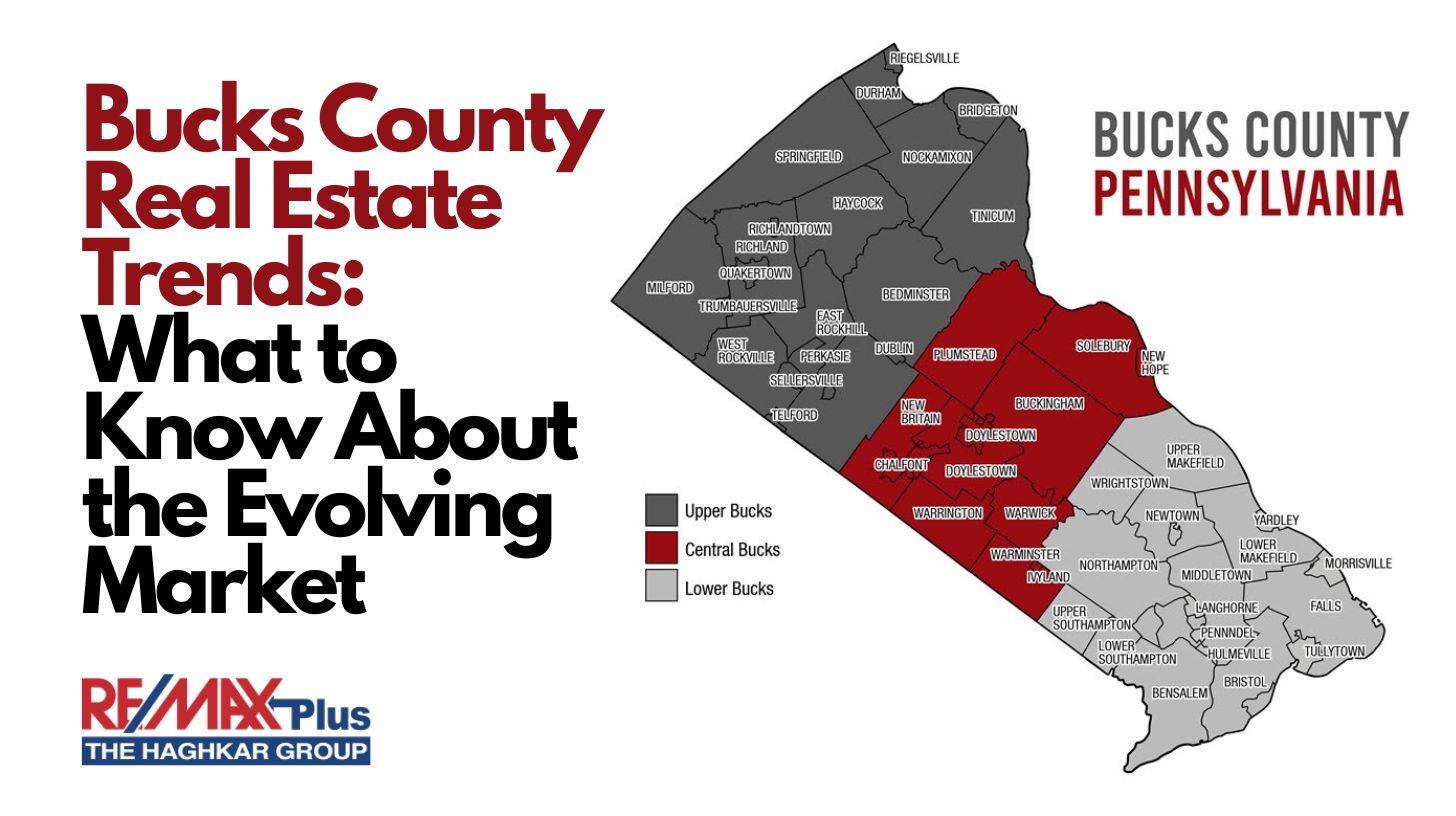
A county median flattens a market running from mid-$400,000s row homes to $800,000-plus river frontage inside the same 30-mile stretch. The table below anchors each tier to a real, dated figure rather than one blended number.
| Area | Recent median sale | Typical stock | School district |
|---|---|---|---|
| Levittown / Lower Bucks boroughs | $404,758 (May 2026) | Post-war single-family, twins | Neshaminy, Bristol Twp |
| Countywide | $546,000 (May 2026); $538K Redfin 3-mo avg | Mixed | – |
| Doylestown / central Bucks | $617,131 (May 2026) | Colonials, borough rowhomes | Central Bucks |
| New Hope–Solebury (ZIP 18938) | $823,000 (March 2026) | Riverfront, estate lots | New Hope–Solebury |
Comparing a $500,000 Quakertown listing against the county median compares it to the wrong number twice over: the county figure blends four sub-markets, and Quakertown itself sits closer to the Levittown tier than to Doylestown’s.
Is Bucks County expensive compared to nearby counties?At a $546,000 county median, Bucks runs above the statewide Pennsylvania median of $318,867 reported for May 2026.
What actually moves the price: school district, river, commute
School district assignment tracks township lines, and correlates closely with distance from the Delaware River once that’s accounted for.
| District | Municipalities covered | 2025/26 total millage (township + school + county) |
|---|---|---|
| Central Bucks | Buckingham Twp, Chalfont Boro, Doylestown Boro, Doylestown Twp | 178.75 – 196.75 |
| Council Rock | Newtown Boro, Newtown Twp, Northampton Twp, Upper Makefield Twp, Wrightstown Twp | not published in the sampled rate sheet |
| Pennsbury | Yardley Boro, Lower Makefield Twp, Falls Twp, Tullytown Boro | not published in the sampled rate sheet |
| Neshaminy | Middletown Twp (partial) | not published in the sampled rate sheet |
Only Central Bucks’ combined rate appeared in the assessment sheet sampled for this page; a buyer comparing tax load across all four districts should pull the current sheet directly from the county rather than rely on partial figures.
Commuting is the one variable the major listing platforms skip entirely. SEPTA’s West Trenton Line timetable, effective July 5, 2026, stops at Yardley, Woodbourne, Langhorne, Neshaminy Falls, and Trevose in Lower Bucks, with published weekday departures putting an off-peak Yardley-to-Center-City run at roughly an hour. Towns north and west of Doylestown have no direct SEPTA stop at all.
Which Bucks County towns have a train to Philadelphia?Yardley, Woodbourne, Langhorne, Neshaminy Falls, and Trevose sit on SEPTA’s West Trenton Line into Center City. Doylestown has its own separate regional-rail terminus. New Hope, Solebury, and most of Upper Bucks have no direct commuter-rail stop.
The costs the list price doesn’t show
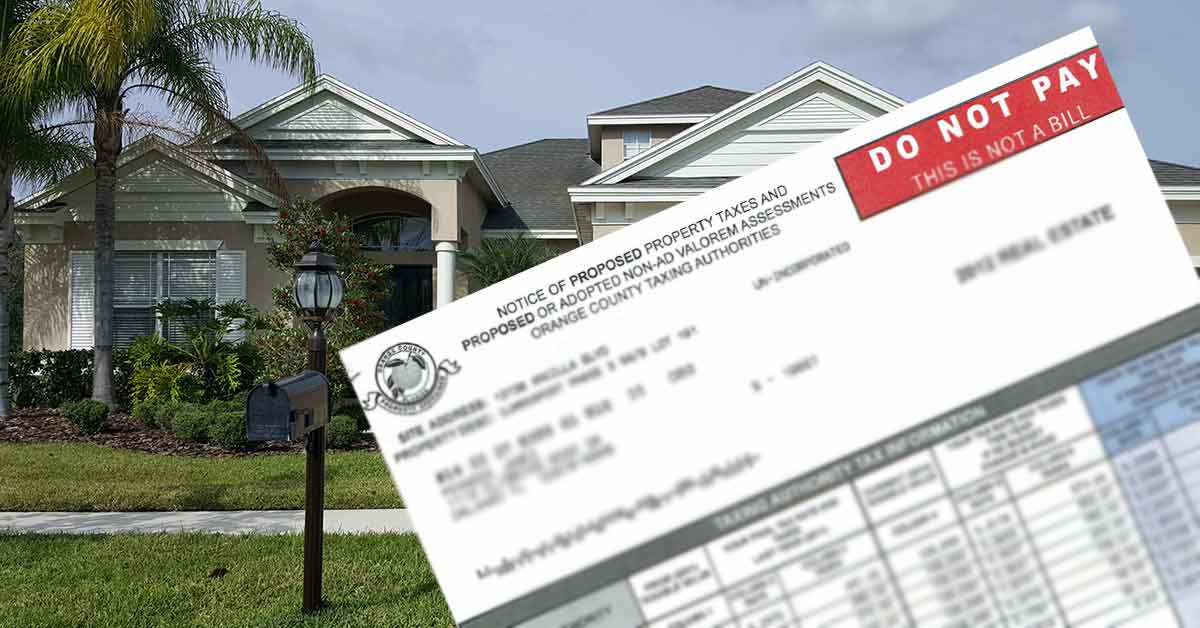
Pennsylvania counties tax real estate on an assessed value, not the sale price, and Bucks County’s assessments still trace to a 1972 base year. The county’s common level ratio, currently 4.4% and set by the state Tax Equalization Board, is the multiplier that converts a modern sale price into a comparable assessed figure. A $546,000 home therefore carries an assessed value near $24,000, against which the local millage rate applies. Three layers stack into one bill: county, township or borough, and school district.
| Layer | Example rate | Approx. annual cost on $546,000 |
|---|---|---|
| County millage (2026) | 29.65 mills | roughly $712 |
| Buckingham Twp / Central Bucks SD (2025/26 total) | 178.75 mills | roughly $4,290 |
| Bristol Twp / Bristol Twp SD (2025/26 total) | 279.17 mills | roughly $6,704 |
Ownwell’s independent estimate puts the county’s median effective property-tax rate at 1.98% and the median annual bill at $5,735, above the $2,400 U.S. median it cites for comparison; its 25th-to-90th-percentile range runs $4,354 to $10,464. Two similarly priced homes in different townships can carry a four-figure gap in carrying cost for that reason alone. Confirm the actual assessed value through the county’s own property record search before making an offer.
Flood zone and river proximity
FEMA’s own guidance notes that properties in low- or moderate-risk zones are still roughly five times more likely to flood than to experience a house fire over 30 years, and the mandatory purchase requirement applies specifically inside a mapped Special Flood Hazard Area. New Hope Borough’s flood maps were substantially redrawn, effective March 16, 2015, changing risk classification for properties that hadn’t moved an inch. Several river-adjacent townships – Solebury, Upper Makefield, Tinicum – sit inside or near mapped floodplain along the Delaware, and the county’s Planning Commission maintains a floodplain viewer that overlays FEMA’s boundaries directly on tax parcels for a pre-offer check.
Do I need flood insurance if I’m not directly on the river?Possibly yes: FEMA’s own risk comparison treats low- and moderate-risk zones as still meaningfully exposed over a 30-year mortgage term, and the purchase requirement is tied to the mapped zone, not to visible proximity to water. Check the current zone through FEMA’s Flood Map Service Center rather than an older paper map.
Where new construction and resale pull apart
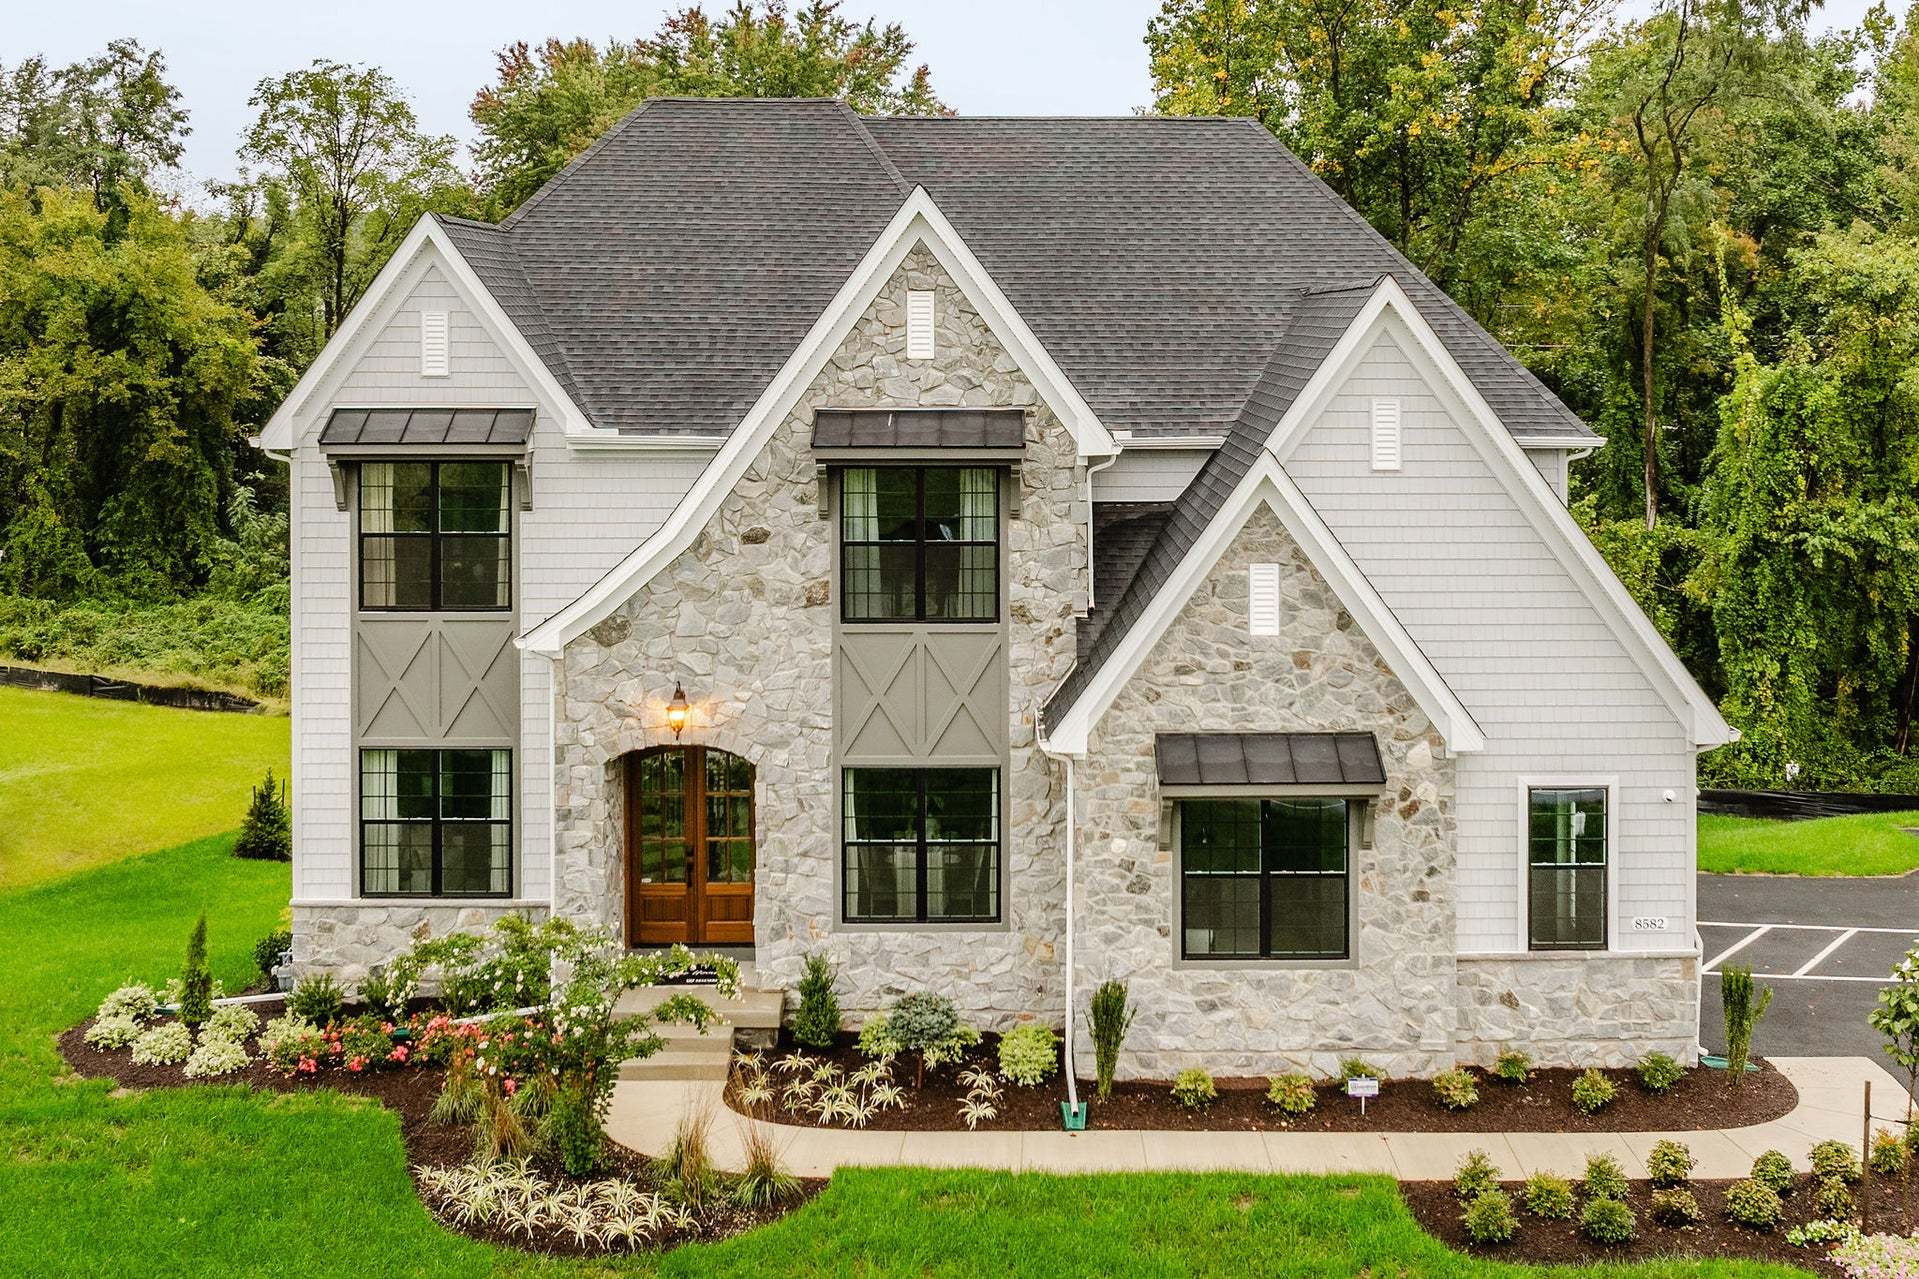
Quakertown’s resale tier tracks closer to the Levittown end of the county’s range than to Doylestown’s midpoint. Toll Brothers’ Steeple Run community in Quakertown was recently listing quick-move-in homes at $657,995 and $717,995 – a builder base price well above typical resale in the same ZIP once lot premiums and standard finish packages are counted. Scanning “$500K in Quakertown” listings without separating new construction from resale badly misjudges what a comparable resale actually costs.
Is new construction actually cheaper than resale here?Not in Quakertown specifically: the premium above reflects lot cost and current finish packages rather than a discount for being new.
Getting from research to an offer
Pre-approval, agent selection, and offer strategy are covered exhaustively elsewhere. The one Bucks-specific step worth adding here is pulling the property’s current assessed value and flood-zone status before writing an offer, since both change the real monthly cost independent of the listed price.
The single most common error in this data: comparing a county-wide median to one specific listing without adjusting for which of the four price tiers that listing actually sits in.
All prices above are point-in-time snapshots from April through June 2026, drawn from Redfin and Bright MLS data. Confirm current figures with an agent or the MLS directly before acting on them.
Comments