
What Homes Are Actually Closing For Right Now
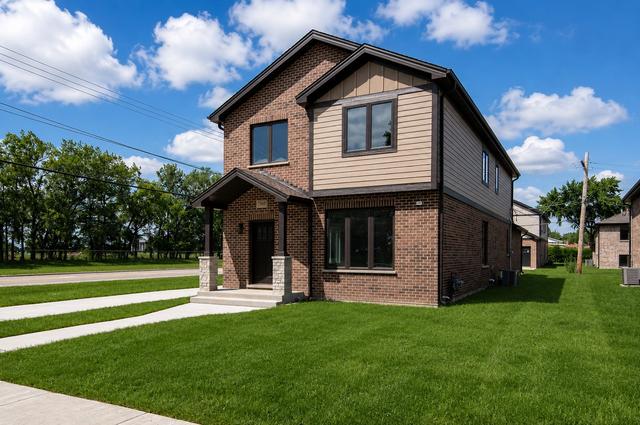
Search for “Bridgeview home value” and you’ll find figures from the $230,000s to the $350,000s, all claiming to describe the same market. They’re not lying: they’re measuring different things at different times.
| Date | Metric | Value | Source |
|---|---|---|---|
| Feb 2025 | Median closed sale | $305,000 ($201/sq ft, 46-day DOM) | Redfin |
| Oct 2025 | Median closed sale, ZIP 60455 | $299,000 (51-day DOM) | Redfin |
| Apr 2026 | Median closed sale, citywide | $298,346 (−3.8% YoY) | Redfin |
| May 2026 | Median active-listing price | $330,000 ($212/sq ft, 15-day DOM) | Movoto |
Closed prices softened slightly over the past year while asking prices held firm and days-on-market compressed, a combination pointing to sellers pricing confidently and buyers still closing near list. A single “median home value” pulled from any one aggregator without a date attached tells you neither.
Why do home-value figures for Bridgeview vary so much between sites? Most of the spread comes from three variables: closed-sale data versus active-listing data, citywide averages versus single-ZIP averages, and how recently each provider refreshed its snapshot. Check which of the three you’re reading before comparing it to another site’s number.
The Real Cost of Owning Here
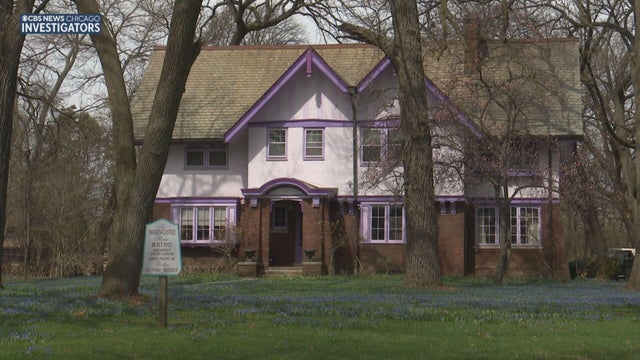
Bridgeview’s median annual property tax bill is $5,228, according to Ownwell’s Cook County township data. Cook County assesses residential property at 10% of market value, then applies the Illinois Department of Revenue’s equalization multiplier, 3.0355 for the 2024 tax year, before local levies apply, per SmartAsset’s breakdown. The upshot: Bridgeview’s effective rate runs close to 3% of market value, above the county-wide median that different trackers place between 1.9% and 2.1%. Explained once, that’s the whole mechanism; the bill on any given property still depends on exemptions and its specific levy district.
Living Next to SeatGeek Stadium
SeatGeek Stadium sits at 7000 S. Harlem Ave. with three parking lots holding about 6,000 vehicles combined; event parking runs $15 to $20, cash-only outside concerts, per Ticketmaster’s venue page. It is not an occasional neighbor. The 2026 calendar runs Chicago Fire FC’s MLS home schedule, Leagues Cup matches in August, the multi-day North Coast Music Festival in September, the Lyrical Lemonade Summer Smash in June, Nitro Circus, the Chicago Truck Invasion, and a Major League Rugby championship final, per the village’s own event announcements. That’s a recurring traffic and noise load on the streets nearest Harlem Avenue on event nights, not a one-line amenity.
The village’s motto, “A Well Balanced Community,” reflects a deliberate planning choice: zoning divided roughly equally between residential, commercial, and industrial use, as the Daily Southtown’s roundup of Southland town mottos put it. That mix is why some Bridgeview blocks sit closer to industrial parcels than similarly priced homes in Hickory Hills typically do; it’s worth a walk-through at different times of day before buying near the village’s industrial pockets.
Does living near SeatGeek Stadium affect resale or day-to-day noise? Streets within a few blocks of the venue see periodic traffic and parking-lot noise on event nights, concentrated on evenings and weekends during MLS season and festival months. It hasn’t shown up as a documented resale discount in available data; treat it as a lifestyle and noise question to check in person, not a proven price effect.
Neighborhoods That Actually Differ
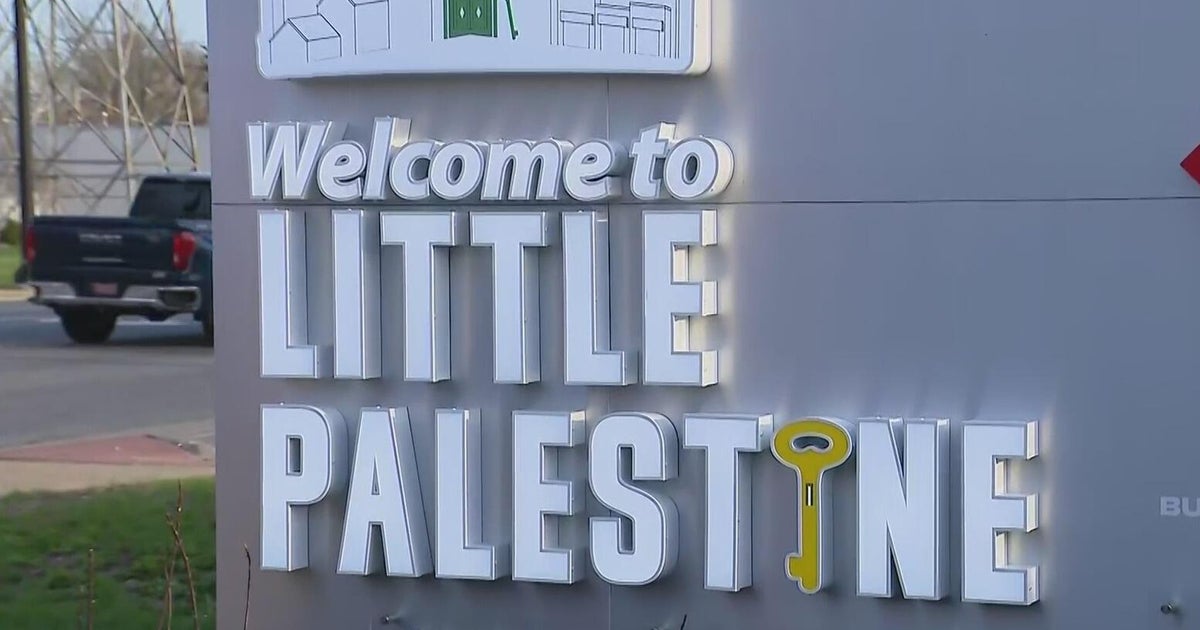
Bridgeview’s Harlem Avenue corridor, from 79th to 113th Street, sits at the center of the largest Palestinian population of any county in the country, concentrated in Cook County since the 1890s according to WBEZ’s analysis of census data. In April 2026, the Arab American Business and Professional Association unveiled honorary “Little Palestine Way” signage along that stretch, following Illinois House Joint Resolution 46, which passed the state House 76 to 33 in November 2025; Cook County separately marked April 7 as Little Palestine Day, per local coverage of the designation. This isn’t tourism copy: a business and residential cluster of this size is a real demand signal, shaping which blocks see faster turnover and steadier owner-occupancy compared with the village’s more industrial-adjacent north side.
What the available data can’t yet support is an independent, dated price band specific to that sub-market as distinct from village-wide figures; treat any such figure you encounter elsewhere skeptically until a dated MLS breakdown exists. Census figures for the village overall show 65.5% owner-occupancy against 34.5% renter households, a split roughly in line with nearby suburbs.
Schools: Why the Grades You’ll See Don’t Agree
GreatSchools rates Indian Springs School District 109, which covers Bridgeview’s public elementary schools, “above average” in both overall school quality and academic progress relative to other Illinois districts, per its district profile. That’s a proprietary rating built from test-score and progress data, a different instrument from Illinois’ own accountability system. For the state’s official Summative Designations, the Illinois Report Card is the authoritative source; treat any single letter grade you see elsewhere as one organization’s methodology, not a verdict.
Is Bridgeview’s school rating bad, or is it measuring something specific? It depends which rating you’re looking at: GreatSchools’ progress and quality scores currently read above average for this district, while other aggregators apply different weightings and can produce a lower letter grade for the same schools. Check the Illinois Report Card directly if a specific school’s state designation matters to your decision.
Crime Data and Its Age

The most current FBI-sourced numbers, covering the 2024 calendar year and released in the fall of 2025, put a Bridgeview resident’s odds of any crime at 1 in 210 and odds of violent crime specifically at 1 in 613, safer than 68% of US communities, per NeighborhoodScout’s analysis.
| Source | Metric | Value | Data year |
|---|---|---|---|
| NeighborhoodScout | Overall crime rate | 1-in-210 victim odds | 2024 (released Oct 2025) |
| CrimeGrade | Total crime rate | 28.60 per 1,000 residents | Most recent available |
| CrimeGrade | Violent crime rate | 3.144 per 1,000 residents | Most recent available |
| CityRating | Violent crime rate | Projected, not measured | Last actual data: 2019 |
| OpenCrime | Murder rate | 6.2 per 100,000 (1 recorded case) | 2020 only |
How current is the crime data being quoted for Bridgeview? The best available figures reflect the 2024 calendar year, released by the FBI in the fall of 2025. Several popular crime-rating sites still display projections built from 2019 or a single 2020 incident; check the stated data year before trusting any site’s grade or percentile.
Flood Risk and Other Costs Nobody Mentions
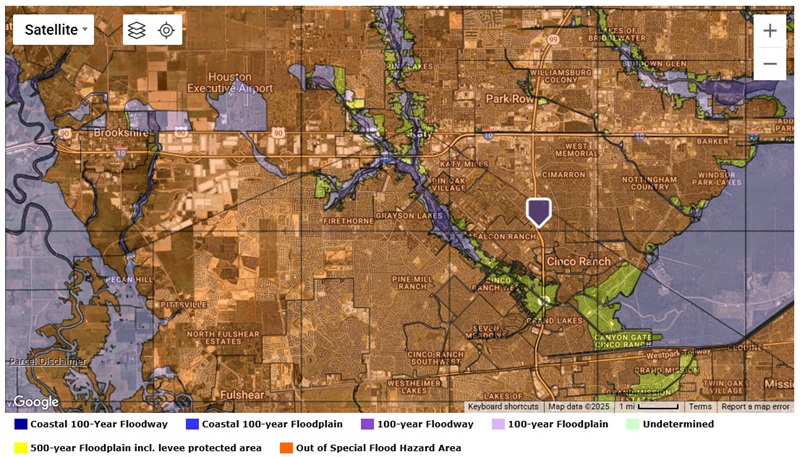
About 21% of Bridgeview properties, 264 parcels, face severe flood risk over the next 30 years, according to First Street data reported through Redfin, versus 16% in both Hickory Hills and Burbank. It’s a minor overall risk, not a dominant one, and it rises more slowly here than the national average; insurance quotes should reflect it regardless.
How Bridgeview Compares to Justice, Hickory Hills, and Burbank
Using one consistent snapshot from Zillow, average asking prices run close together across this cluster of suburbs: Bridgeview at $262,319, Justice at $260,229, Burbank at $267,348, and Hickory Hills at $291,355. Flood-risk data specific to Justice wasn’t available at the time of writing, so it’s omitted from the table below rather than estimated.
| Suburb | Avg. asking price (Zillow) | Homes at severe 30-yr flood risk |
|---|---|---|
| Bridgeview | $262,319 | 21% |
| Burbank | $267,348 | 16% |
| Hickory Hills | $291,355 | 16% |
Hickory Hills commands roughly $29,000 more than Bridgeview on this snapshot while carrying five points less flood exposure; a buyer choosing purely on sticker price is also choosing a materially different risk profile.
Is Bridgeview or a neighboring suburb the better buy right now? On raw price, Bridgeview and Justice run nearly identical and both undercut Hickory Hills by roughly $30,000. Hickory Hills’ premium buys measurably lower flood exposure; Bridgeview’s discount buys the Little Palestine corridor’s commercial density and SeatGeek Stadium’s amenity-and-noise tradeoff. Neither is objectively better without knowing which of those you’re pricing in.
For Investors: What Rent Covers at Each Price Point
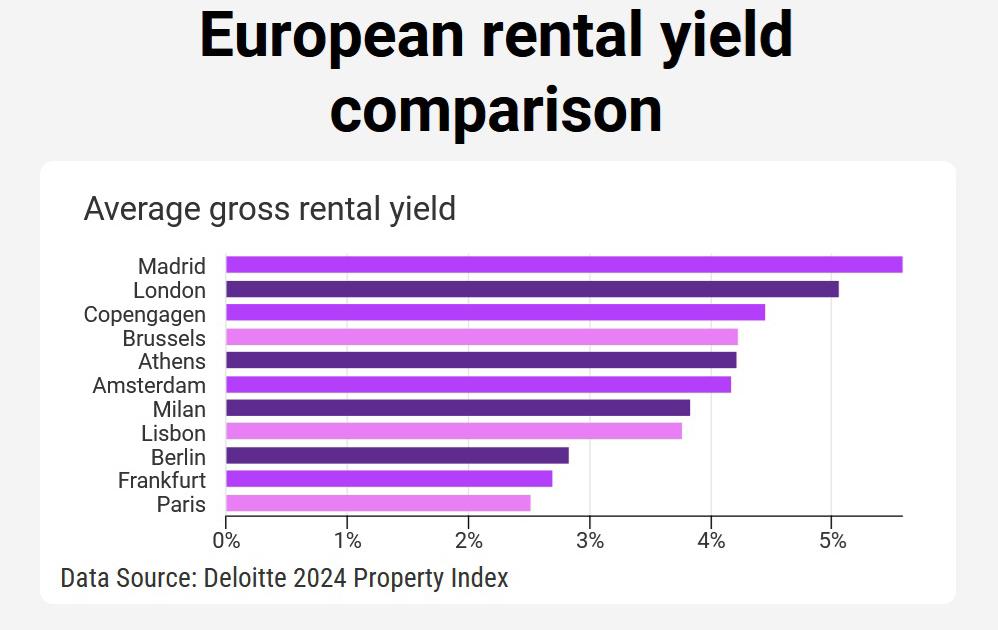
Census data (2019–2023 five-year estimate) puts Bridgeview’s median gross rent across all rental units at $1,139 a month, up 20.4% since 2020, per the Census Bureau’s American Community Survey. That figure blends condos, small apartments, and houses together, so it understates what a single-family rental specifically commands today.
| Property type | Current asking rent (Jul 2026) | Approx. annual yield vs. $298K–$330K sale range |
|---|---|---|
| Single-family | $2,700/mo | 9.8% to 10.9% |
| Townhouse | $2,550/mo | 9.3% to 10.3% |
| Condo | $1,425/mo | 5.2% to 5.7% |
Source for current asking rents: Homes.com, July 2026.
A single-family purchase in Bridgeview currently pencils out to nearly double the gross yield of a condo purchase at the same reconciled price range, before property tax, insurance, and vacancy come out of that number.
Comments