
Current Market Snapshot
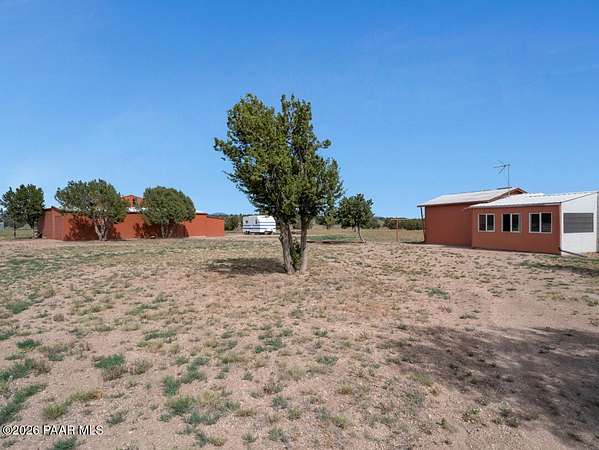
An automated valuation model tracking roughly 1,018 Ash Fork properties put the median at $155,417 as of June 2026, with individual values ranging from $10,892 to $1,498,288 (Foreclosure.com property data). That spread is the clearest sign that raw land and finished homes are being averaged into one figure almost everywhere this town’s numbers appear. A separate, smoothed home-value index puts the average home at $180,318, up a modest 1.4% year over year (Zillow’s home value index), a useful contrast against the sales-based figures below, which move far more violently on the same underlying market.
By Property Type
| Property Type | Median List / Sale | $/Sqft or $/Acre | Typical Time to Sell | Source |
|---|---|---|---|---|
| Finished home (list) | $299,000 (Apr 2026) | $224/sqft | 182 days | Movoto homes |
| Finished home (sold) | $315,000 (Feb 2026) | – | 195 days | Movoto market trends |
| Land parcel (list) | $282,000 (Jun 2026) | $225/acre-equivalent | 176 days | Movoto land |
| Land parcel (list) | $199,348 (Dec 2024) | – | 139 days | Rocket Homes land |
| Blended, all types (list) | $255,000 (Jun 2025) | $241/sqft | 174 days avg. listing age | Rocket Homes report |
Both segments move at a similar pace, 170 to 195 days on average, well behind Arizona’s statewide figure of 67 days (Redfin’s Arizona housing market data). The land and home medians sit closer together than a typical rural market, most likely because a share of the listed “land” inventory carries utility hookups or partial improvements rather than being raw acreage; treat the two rows as overlapping ranges. Income math should be built off the finished-home figure for anyone planning to occupy the property: at $299,000 with 25% down, the calculation Movoto publishes puts the required household income at $56,400 a year; the land-only version of the same math, $53,300 against a $282,000 parcel, understates what a buyer needs once a house goes on that land.
Why does Ash Fork’s median price jump so much from one report to the next? Because the town sells only a handful of properties most months, and different sites define “Ash Fork” differently. Redfin’s ZIP-code page and its city-boundary page, both live at the same time, disagree with each other on basic risk percentages for the same town; one Rocket Homes page files the town under Coconino County while most demographic sources place it in Yavapai County. A reported 400% jump to $150,000 or an 87% jump to $350,000 in a single month reflects one or two sales changing the mix, not a shift in what the town is worth.
Is This a Buyer’s or a Seller’s Market Right Now
| Metric | Current Figure | What It Means for a Buyer |
|---|---|---|
| Homes sold under asking | 100% of June 2025 sales | Full asking price is not the norm here |
| Sales taking over 90 days | 67% of June 2025 sales | Expect a long closing runway, not a bidding war |
| Sales taking under 30 days | 0% of June 2025 sales | A fast sale is currently the exception |
| Average listing age | 174 days (down 51.1% year over year) | Inventory is turning faster than a year ago, even while still slow overall |
Every home in the most recent full month tracked by Rocket Homes’ Ash Fork market report sold under its asking price, and two-thirds of those sales took over three months, which puts room for a below-list opening offer on the table rather than in the realm of hope. Two figures on this topic deserve direct skepticism instead of repetition: the same report’s 49.0% one-year jump in three-bedroom list prices, and a separate 400% jump to a $150,000 median sale price reported on Redfin’s city-boundary page. Both are drawn from monthly sales counts in the single digits; a market this thin does not produce a genuine swing of that size in one month, whatever the percentage says.
Is now a good time to negotiate on a home here? The most recent full month of sold-price data available showed every closed sale coming in under asking, with two-thirds of those sales taking longer than 90 days. That combination favors an opening offer below list, though the same small sample size applies: three sales is not thirty.
Water and Sewer Status You Need to Verify Before Buying
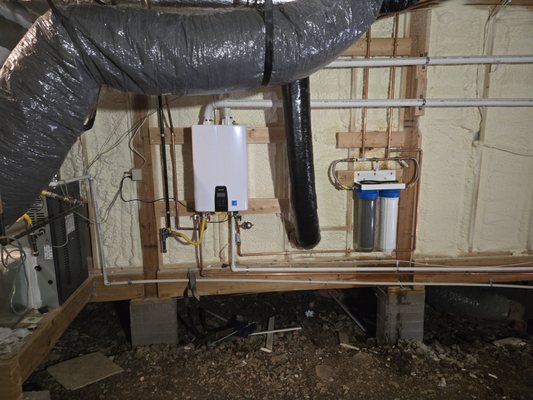
Roughly 150 cesspools were still in active use in downtown Ash Fork as of late 2024, a practice Arizona banned in 1972 and that county officials have begun actively enforcing (Williams News coverage of a resident meeting). The Ash Fork Sanitation District secured a $75,000 state grant to fund an engineering report on wastewater options, and residents were told a vote on adopting a new system was planned for spring 2025; if that vote failed, state authorities retained the ability to mandate a system regardless. No public confirmation of that vote’s outcome turned up in current search results, so treat the system’s status as unresolved and verify it directly with the sanitation district or Yavapai County Environmental Services before assuming what a specific parcel can support.
This single unresolved fact does more to change a buyer’s due-diligence checklist than any price statistic on this page: a property on a working system and one still on a cesspool awaiting a district-wide fix are not the same purchase, whatever their list prices say.
Does Ash Fork have municipal sewer service? Not confirmed as of the most recent reporting found: much of downtown still runs on cesspools that are already illegal under state law, a resident vote on a new system was pending as of late 2024, and the outcome isn’t independently verified. Ask the seller’s agent or the sanitation district directly for the parcel’s current wastewater arrangement before writing an offer.
Wildfire, Flood, and Heat Risk
| Risk Type | 30-Year Exposure | Practical Implication |
|---|---|---|
| Wildfire | 99% of properties (8,587) | Defensible-space work and insurer scrutiny should be assumed for nearly any parcel |
| Extreme heat | 91% of properties | Days above 94°F projected to rise 157% over 30 years |
| Flood | 13% of properties, moderate | Lower priority than wildfire, worth a flood-zone check on specific lots |
| Wind | Minimal | Not a meaningful factor here |
A near-universal wildfire exposure rate means insurance availability and premium, not just price, belongs on the checklist for any parcel here (Redfin’s ZIP 86320 page, citing First Street Foundation data). Redfin’s separate city-boundary page reports different figures for the same categories, 3% flood and 95% heat instead of 13% and 91%, one more instance of the boundary problem raised above.
What This Means for Insurance and Building
Specific premium figures for Ash Fork parcels were not available in the sources gathered for this page; that gap is listed as an open research item below rather than estimated.
Who Ash Fork Actually Suits
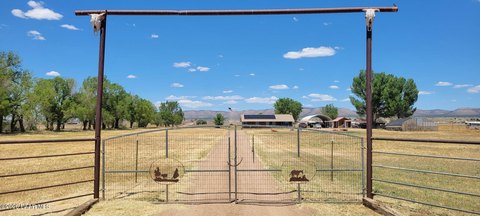
Movoto names Wineglass Acres as the area’s best-regarded and safest neighborhood, though no independent crime statistic for that specific neighborhood turned up in this research, so treat the label as a real estate site’s characterization rather than a verified ranking. Anyone drawn to that neighborhood, or any other parcel here, should still run the utilities check above before assuming a listing is move-in ready.
The Local Economy, in Context
One dataset puts Ash Fork’s unemployment rate at 28.76%, over six times the national rate of 4.54%, alongside a median household income of $58,332 against an $83,181 national figure and a 34.18-minute average commute (U.S. News’ Ash Fork profile, sourced to Census ACS data). That unemployment figure is real but needs context most sources skip: employment counts for the town dropped from 82 to 61 employees between 2023 and 2024, a 25.6% swing (Data USA’s Ash Fork profile). In a labor force that size, a handful of people changing jobs moves the unemployment percentage by double digits; the same volatility shows up in the Census Bureau’s place-level profile for Ash Fork, which lists median household income as a statistically unreliable estimate too small to publish.
A larger surrounding area carrying the Ash Fork name tells a different, still-shaky story: the county census division version of Ash Fork reports a median household income of $50,319, with a margin of error of $9,451, close to a fifth of the estimate itself. Three sources, three different Ash Forks, three different income figures, none exactly wrong, each describing a different-sized area under the same name.
Is Ash Fork’s high unemployment rate a red flag? Treat it as a symptom of a tiny labor force rather than a verdict on the local economy. A swing from 82 to 61 employed residents in one year, documented in Census-derived data, is enough on its own to move the unemployment percentage by double digits in a town this size.
Where Ash Fork Sits

Ash Fork sits along Route 66 in northern Arizona, roughly 50 driving minutes from Flagstaff and about 20 minutes from Williams. It straddles a county boundary in local data systems: most demographic sources file it in Yavapai County, while at least one active MLS-fed listing page files it in Coconino County. Confirm which county’s records apply before relying on any single county-level tax or zoning figure for a specific parcel.
Comments