
Why rent estimates for Santa Monica disagree
Two people can each ask what the average rent in Santa Monica is and get numbers thousands of dollars apart, and both can be right. Listing-based sources report the asking price on units currently advertised, which skews toward turnover units and newer buildings. City records track a different number entirely: the Maximum Allowable Rent on a unit with a long-term tenant, built up from small annual increases rather than reset at market value. A national comparison adds a third layer: the Census Bureau’s $1,413 median gross rent for 2020–2024 covers all U.S. housing units, not apartments specifically. None of these three numbers is wrong. They measure three different populations of units.
Average rent by bedroom size
| Bedroom count | Average asking rent | Basis |
|---|---|---|
| Studio | $2,169 | Current listings, 2026 |
| One-bedroom | $2,400 | Current listings, 2026 |
| Two-bedroom | $4,594 | Current listings, 2026 |
The jump from one-bedroom to two-bedroom, nearly double, is steeper than in most coastal California markets, where the typical multiplier runs closer to 1.3 to 1.5x. That fits a market where two-bedroom units skew toward newer, Costa-Hawkins-exempt buildings pricing at whatever the market bears, while more of the one-bedroom and studio inventory sits in older, rent-controlled stock.
What income do I need to qualify for an average Santa Monica apartment?California landlords commonly require gross household income of 2.5 to 3 times the monthly rent, per housing-counseling guidance from the Sacramento Renters Helpline. At the $2,400 one-bedroom average, that’s roughly $6,000 to $7,200 a month in gross income; at the $4,594 two-bedroom average, roughly $11,500 to $13,800.
Santa Monica’s rent control ordinance and why it matters for pricing
Most apartments built on or before April 10, 1979 are covered by one of California’s oldest local rent-control laws, adopted by voters that same month. Coverage isn’t cosmetic: covered units carry a registered Maximum Allowable Rent that increases only by the Rent Control Board’s annual General Adjustment, set at 2.6% for September 2026, capped at $70 a month for units already at or above a $2,674 MAR. That ceiling is why a listing-based average can sit well above what a long-tenured renter next door actually pays.
Which buildings are exempt
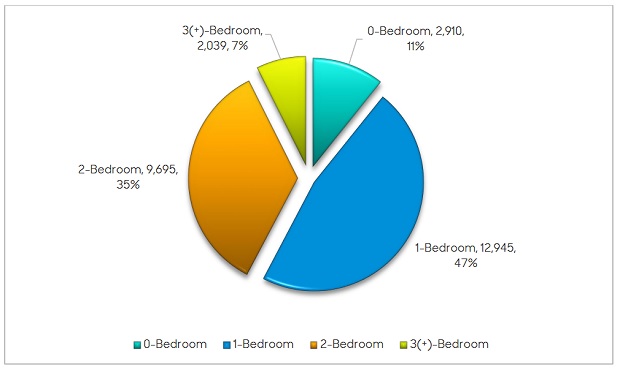
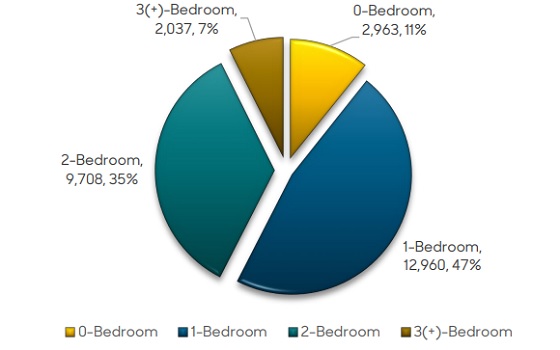
Two categories fall outside the local ordinance regardless of age: single-family homes and condominiums, exempt under the state’s Costa-Hawkins Rental Housing Act, and any building with a certificate of occupancy issued after February 1, 1995, which Costa-Hawkins classifies as new construction. As of the Rent Control Board’s most recent annual report, 27,603 rental units in the city carried active MAR registrations, a rough proxy for how much of Santa Monica’s rental stock the ordinance still reaches.
Is my Santa Monica apartment covered by rent control?If the building’s certificate of occupancy predates April 10, 1979, and it isn’t a single-family home or a separately titled condominium, the unit is very likely covered and has a registered MAR on file with the Rent Control Board.
What happens to my rent if I move out and someone new moves in?Under Costa-Hawkins vacancy decontrol, the landlord can reset a covered unit’s rent to market rate for the incoming tenant. That new starting rent then becomes the base for future General Adjustment increases, so a unit’s registered MAR can jump sharply between tenancies even though annual increases for a sitting tenant stay small.
Owners may also pass through up to half of the annual per-unit registration fee, currently $10 a month per tenant, on top of the General Adjustment.
Rent by neighborhood
| Neighborhood | Average one-bedroom rent |
|---|---|
| Sierra Vista Heights | $2,195 |
| South Santa Monica | $2,300 |
| Ocean Park | $2,400 |
| Pico | $2,535 |
| Sunset Park | $2,595 |
| Downtown Santa Monica | $2,855 |
| Wilshire-Montana | $3,095 |
| Northeast Santa Monica | $3,555 |
| North of Montana | $3,950 |
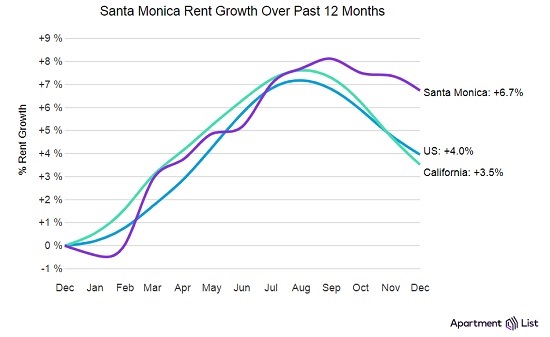
Rent climbs fairly steadily moving from Sierra Vista Heights toward North of Montana, roughly $1,750 across nine neighborhoods, which tracks proximity to the beach and to the city’s older single-family-home districts.
Why do average-rent figures for Santa Monica differ across sources?Because they measure different things: asking rent on current listings, registered Maximum Allowable Rent on occupied units, and national all-housing medians all answer a different question, even when each source calls its number “average rent.”
How Santa Monica compares to the national rent level
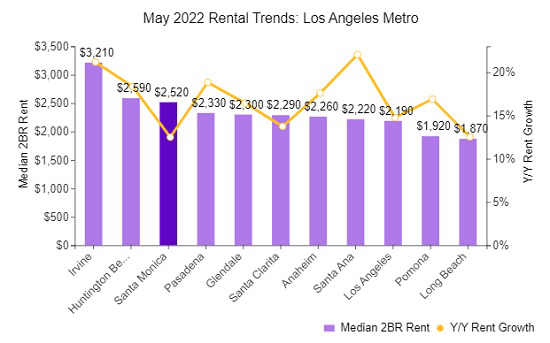
Santa Monica’s one-bedroom average of $2,400 runs about 70% above the Census Bureau’s $1,413 national median gross rent for 2020–2024. A same-methodology comparison against a specific neighboring city, Beverly Hills or West LA, would need a dataset covering both cities at once; nothing meeting that bar turned up in this research pass, so that comparison is listed as an open task in the sourcing notes below rather than estimated here.
What these numbers mean for investors and agents
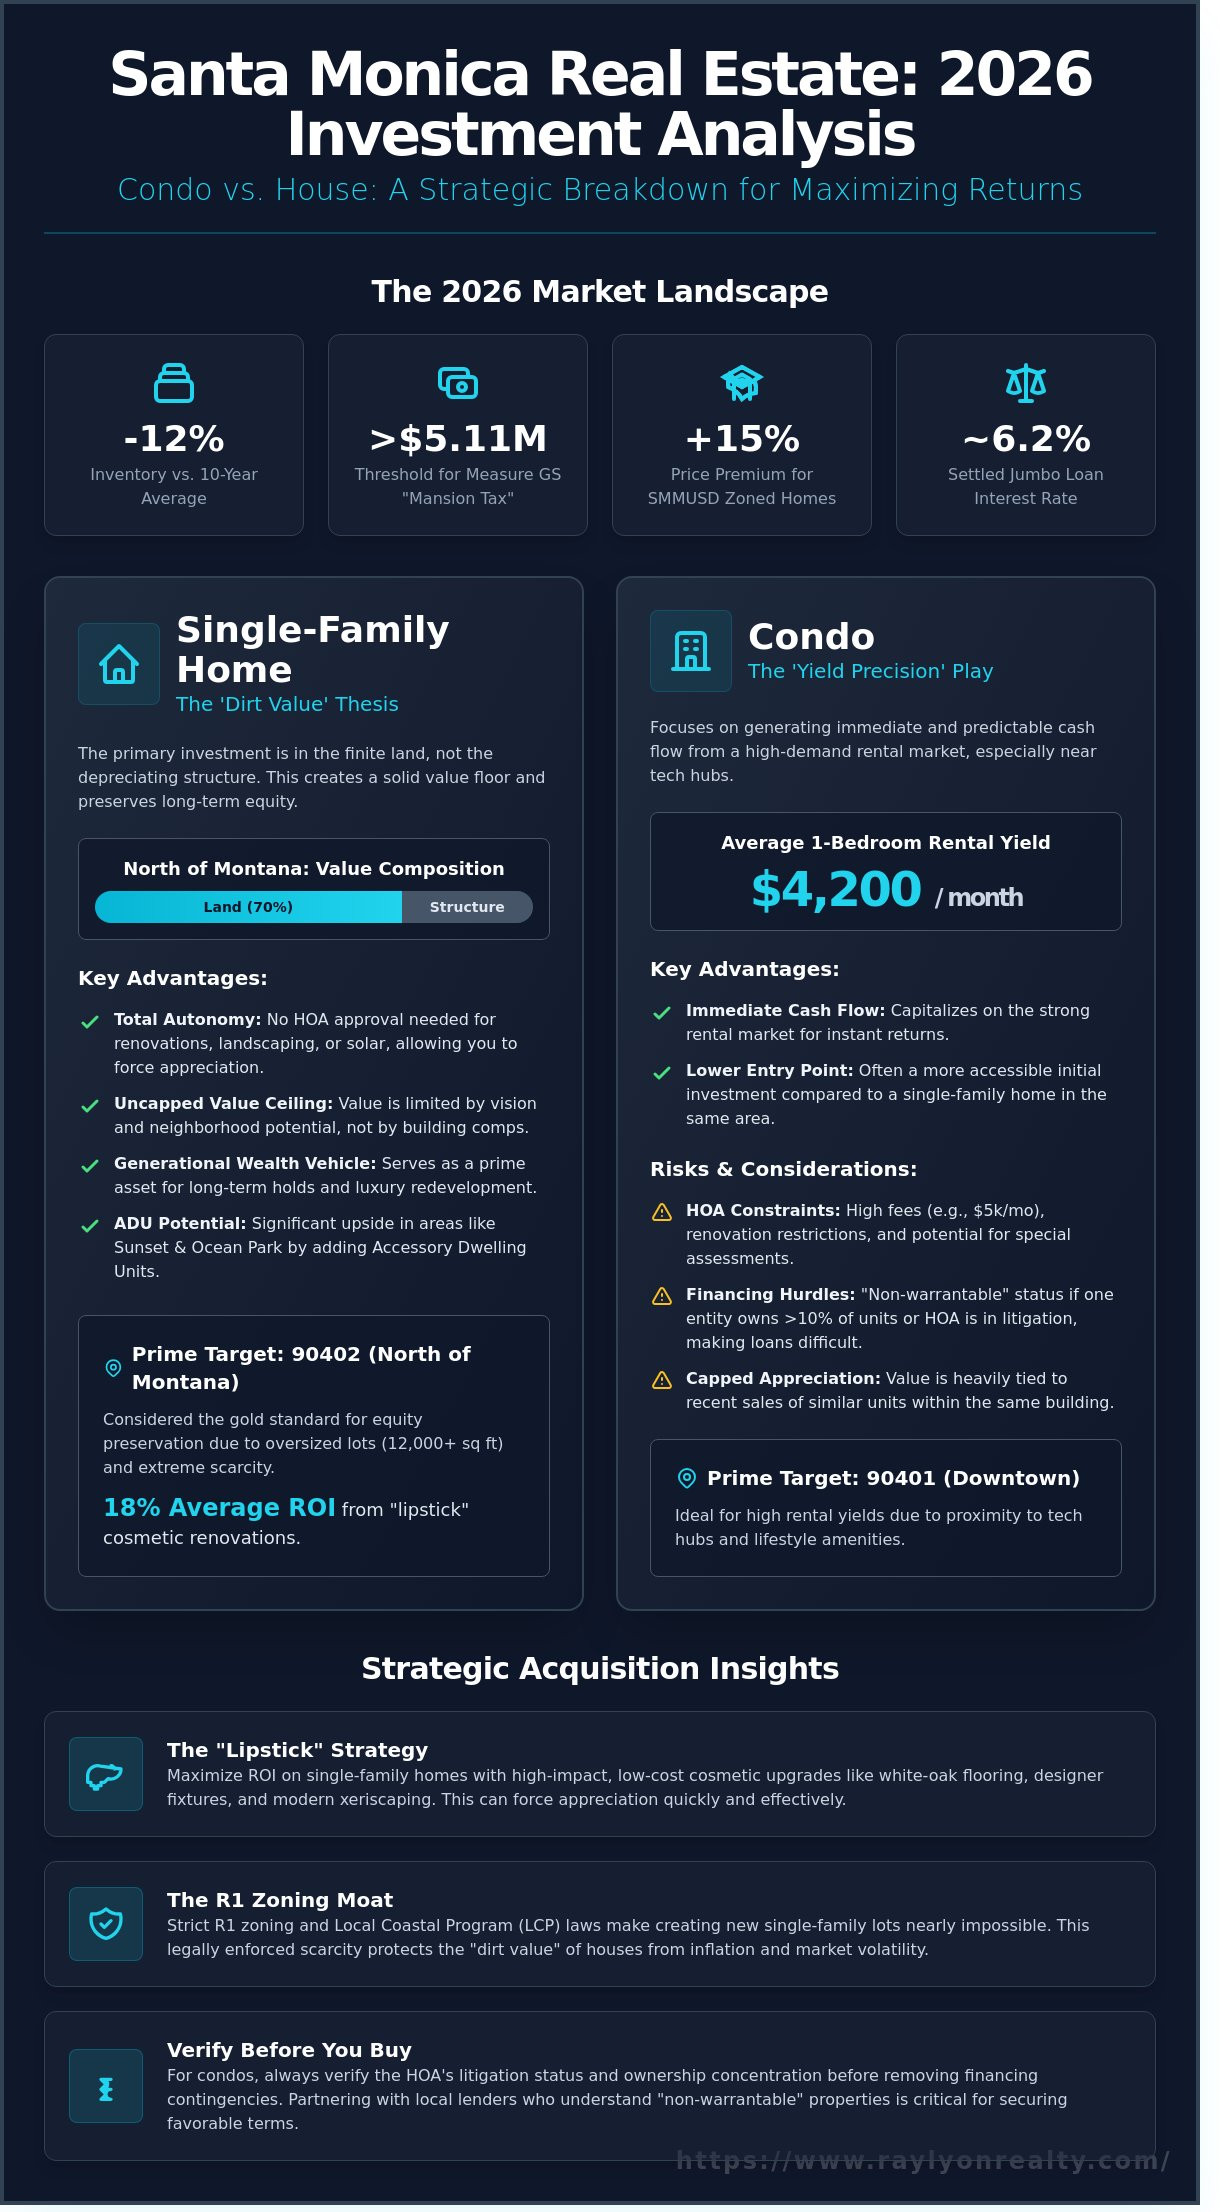
For anyone underwriting or pricing a Santa Monica rental rather than budgeting to live in one, two figures matter more than the headline average. The gross rent multiplier, purchase price divided by annual rent, estimates how many years of gross rent it takes to cover the purchase price; a $1.2 million unit renting at $4,594 a month carries a GRM near 22, high by national investment standards and typical of coastal California, where price appreciation rather than rental yield drives returns. Second, when sizing the tenant pool a specific unit will draw, apply the landlord-side standard directly to the asking rent, gross income of 2.5 to 3 times that figure, rather than the renter-facing 30%-of-income framing budgeting tools typically use. Rent-controlled buildings add a third variable non-rent-controlled underwriting doesn’t need: a below-market MAR on a long-tenured unit depresses current cash flow, but that gap closes automatically at the next vacancy through Costa-Hawkins decontrol, an effect worth modeling explicitly rather than assuming away.
Regulatory quick-reference
| Rule | What it means | Who it applies to |
|---|---|---|
| Annual General Adjustment | 2.6% increase for Sept 2026, capped at $70/month for MAR ≥ $2,674 | Covered pre-1979 units |
| Coverage cutoff | Certificate of occupancy on or before April 10, 1979 | Multi-unit rental buildings |
| Costa-Hawkins new-construction exemption | Certificate of occupancy issued after Feb 1, 1995 | Newer buildings, permanently exempt |
| Registration fee pass-through | Up to 50% of annual fee, $10/month for 2025–2026 | Covered units only |
What these numbers don’t cover
Furnished units, short-term and corporate rentals, and single-family-home rentals are typically excluded or under-represented in the listings data behind the figures above. Anyone searching those categories specifically should expect the real range to run both above and below the numbers here.
Comments