
Submarkets at a glance
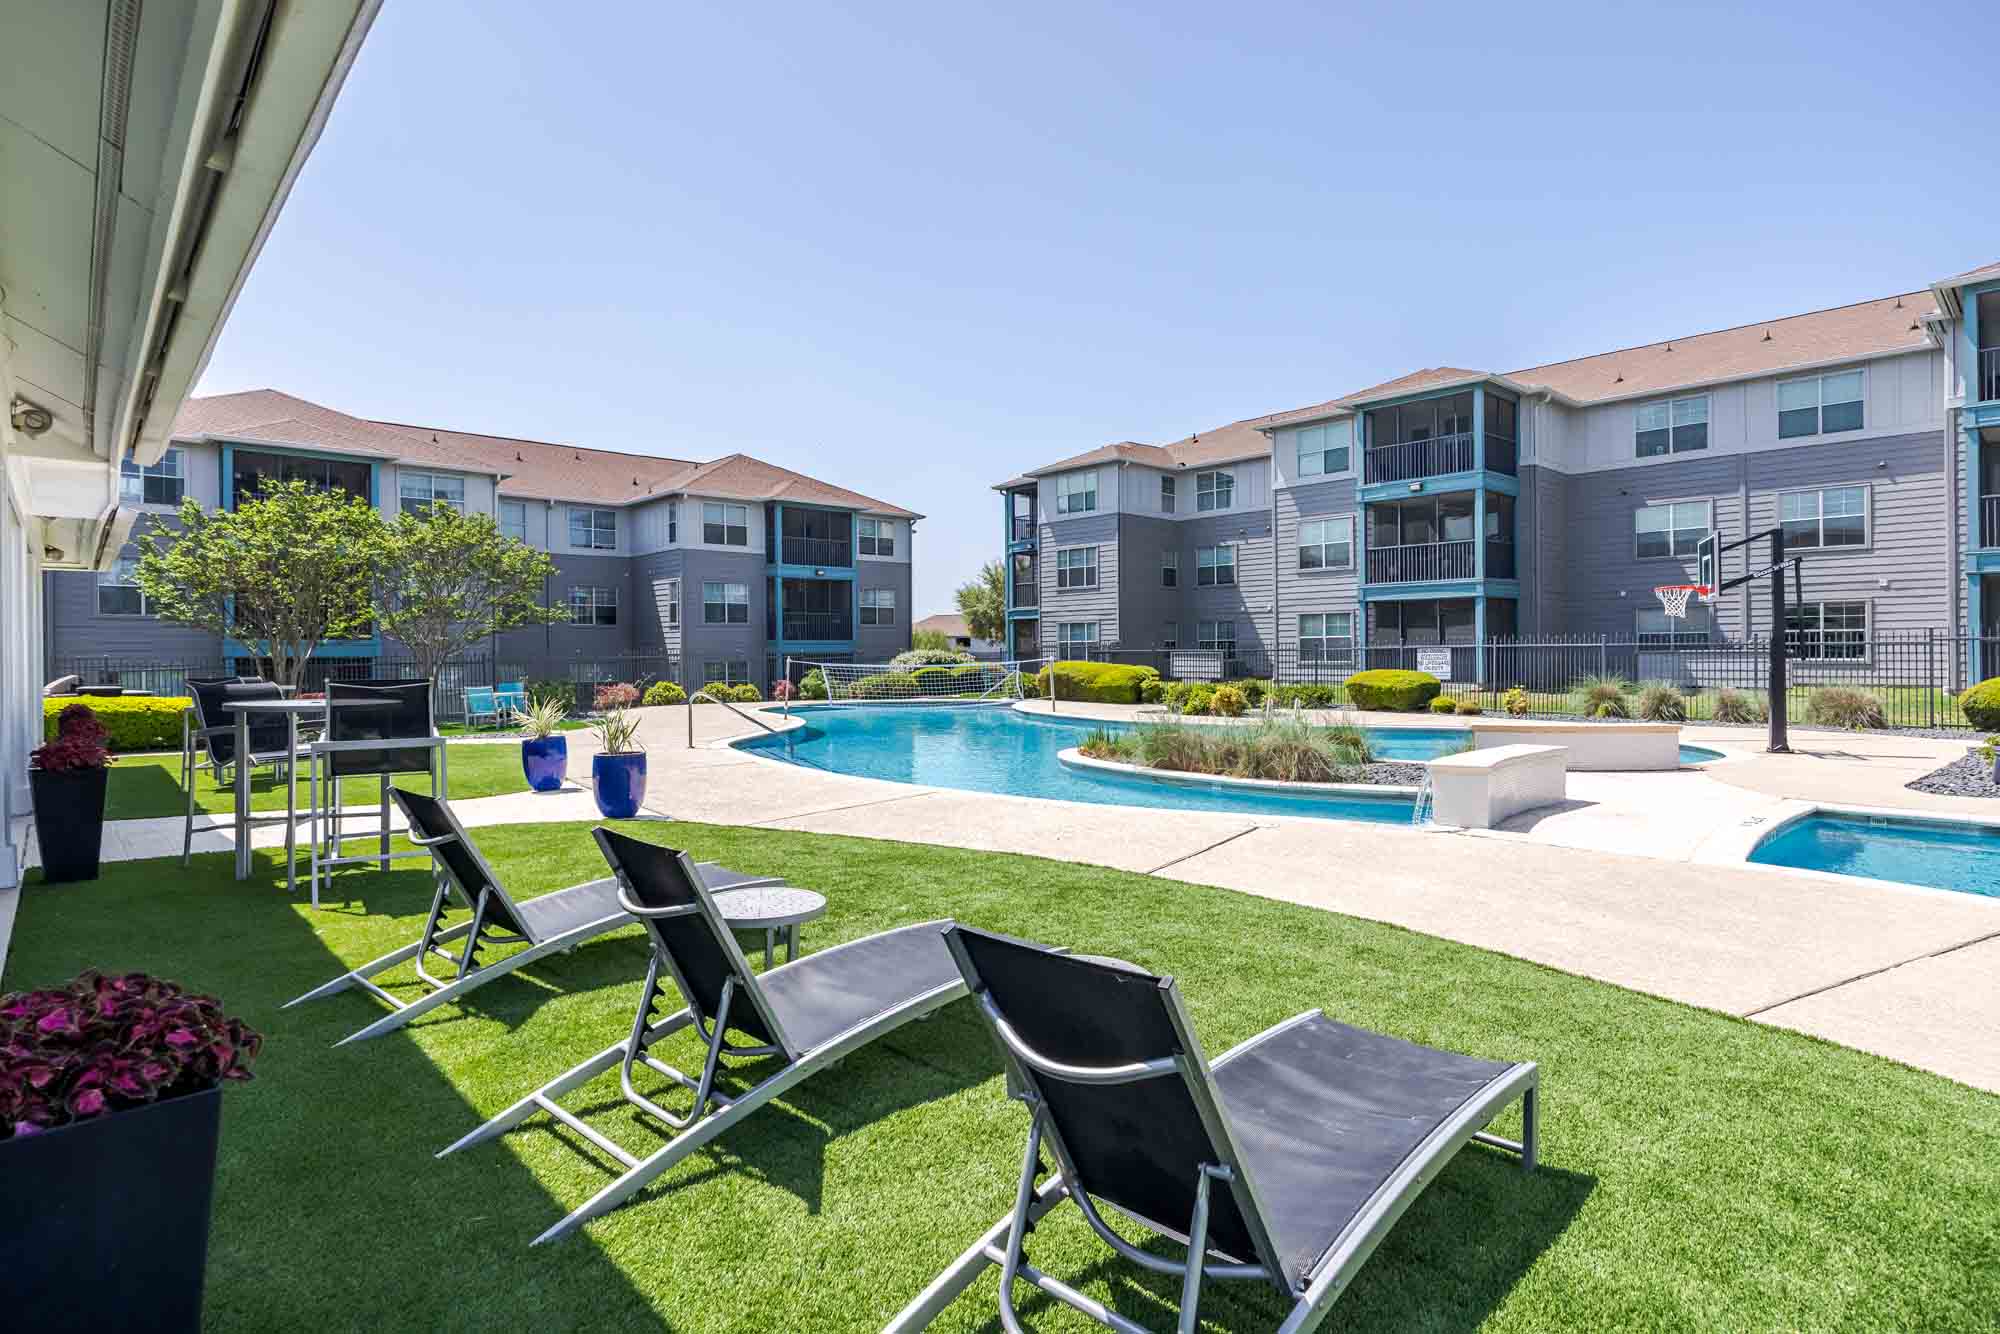
San Marcos’s rental stock clusters into four corridors, and each carries a different limitation an investor or agent should check before comparing price alone: the I-35 frontage north and south of downtown, the Aquarena Springs/river corridor, the Wonder World Dr–Hunter Rd garden-apartment belt, and the near-campus/downtown blocks around Sessom and the historic square.
| Submarket | Location marker | Typical rent band (observed) | Known limitation |
|---|---|---|---|
| I-35 corridor | North and south IH-35 frontage | $1,018–$1,515/mo | Highway noise and access congestion at peak commute hours |
| Aquarena Springs / river | Aquarena Springs Dr toward the Meadows Center | $879–$1,325/mo | River-corridor flood exposure; check current FIRM panel |
| Wonder World Dr–Hunter Rd | West of I-35, garden-style stock | $1,025–$1,735/mo | Farther from campus; car-dependent |
| Near-campus / downtown | Sessom, Comanche, the square | $499–$1,616/mo (mixed per-bed and per-unit) | Per-bed vs. per-unit pricing mixed on the same street; see below |
Rent bands here come from active San Marcos listings on Apartments.com, sampled at one point in time; the near-campus band is widest because it mixes purpose-built student housing with conventional units.
Named complexes by submarket
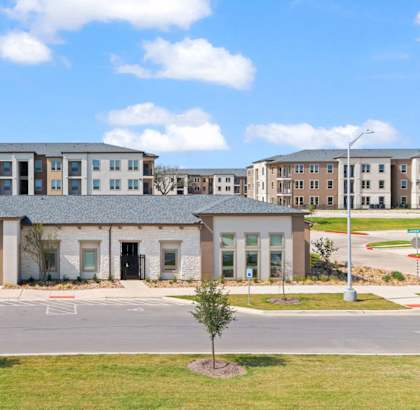
Ownership, exact unit count, and year built could not be confirmed against Hays County Appraisal District records in this pass, so those columns are left out rather than estimated; they’re listed as an open research task below. What follows is a working, address-verified sample by corridor, not the full multi-hundred-property inventory a search aggregator carries.
| Complex | Address | Submarket | Starting rent |
|---|---|---|---|
| Ranch at 1856 | 1805 IH-35 N | I-35 corridor | $795+ (1BR) |
| Springmarc | 1350 Sadler Dr | I-35 corridor | $1,299+ (1BR) |
| Arise Riverside Ranch | 1805 Aquarena Springs Dr | Aquarena Springs / river | $779+ (1BR) |
| River Oaks Villas | 1900 Aquarena Springs Dr | Aquarena Springs / river | $930+ (1BR) |
| Grand at Stone Creek | 490 Barnes Dr | Wonder World Dr corridor | $1,025+ (1BR) |
| Strait & Nelson | 2380 Staples Rd | Wonder World Dr corridor | $1,344+ (1BR) |
| The Local Downtown | 210 N Edward Gary St | Near-campus / downtown | $1,616+ (1BR) |
| The Merriman | 1301 Leah Ave | Near-campus / downtown | New delivery, 313 units |
Every address above is pulled from active public listings; treat this as a starting map for county-record verification, not a substitute for it.
New supply and what it means for rent trends
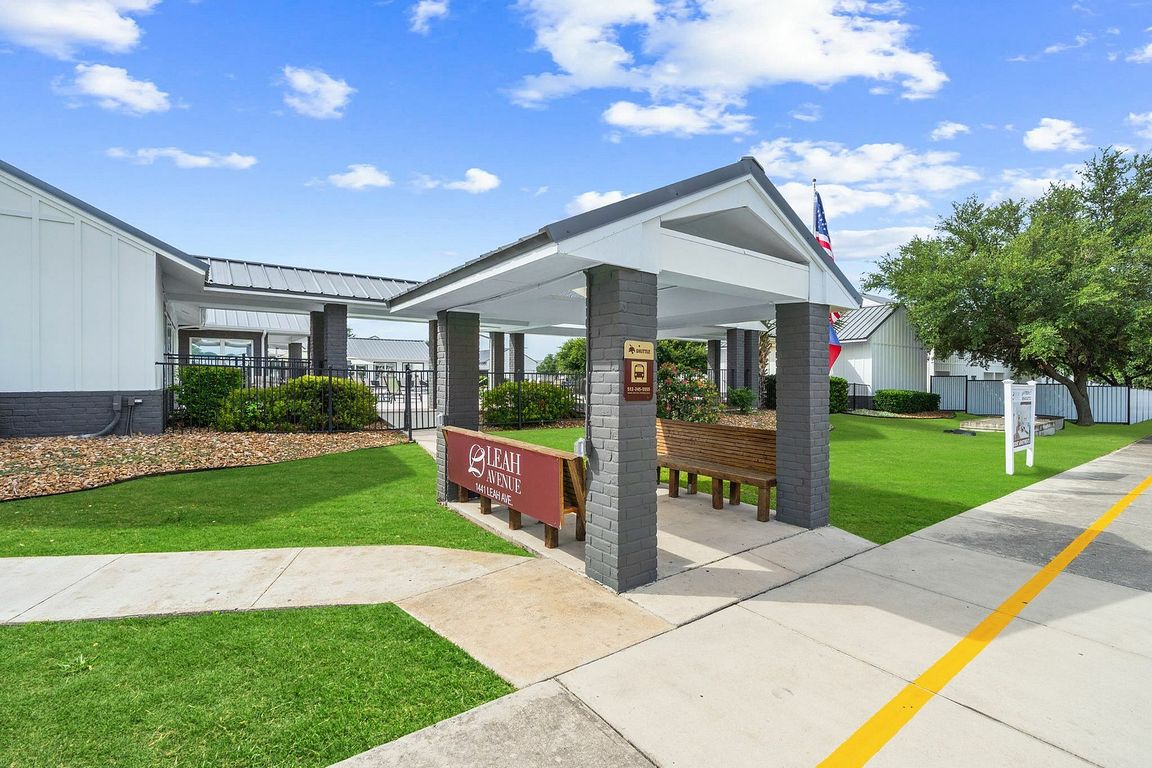
The clearest sourced new-supply fact in San Marcos right now is The Merriman. It replaced the former Starplex movie theater site on Leah Avenue, demolished in 2022; developer Long View Equity broke ground in September 2023 and had the 313-unit, nine-building project on track for completion by fall 2025. A single delivery that size sits at roughly a percent or two of the city’s active listing pool, which is directionally consistent with the softening Apartment List reports but doesn’t by itself explain a citywide 6.0% year-over-year decline. A full pipeline count from city or county permit data would settle how much of the trend is supply-driven, and that count wasn’t available in this pass.
Is new apartment supply pushing San Marcos rents down?Apartment List’s July 2026 report shows median rent down 6.0% year-over-year and down 0.9% from the prior month. At least one sizable delivery, The Merriman’s 313 units, entered the market in this window. A full pipeline count from permit data would confirm how much of the softening traces to supply versus seasonal demand.
Per-bed vs. per-unit pricing
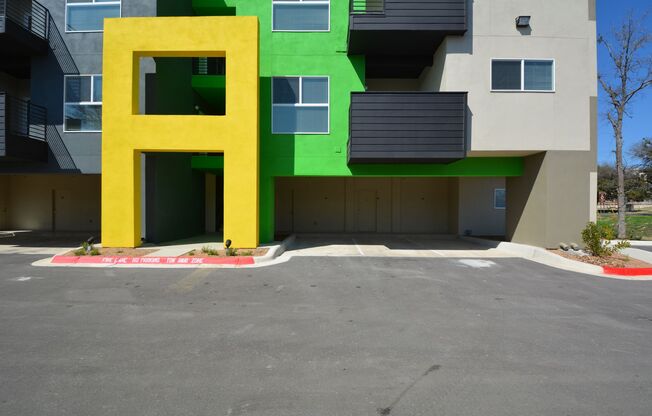
San Marcos prices two different products under one search term. Near-campus complexes often quote a per-bed rate on a shared unit. Garden and mid-rise complexes elsewhere quote a per-unit rate for the whole apartment.
Comparing a $499 per-bed listing to a $1,300 per-unit listing as if they measured the same thing produces the wrong read on which submarket is cheaper. The two figures describe different obligations: one covers a bedroom in a shared lease, the other covers an entire unit.
What’s the difference between per-bed and per-unit pricing here?Per-bed pricing charges each occupant of a shared unit separately and is common in purpose-built student housing near campus. Per-unit pricing charges one rate for the whole apartment regardless of occupant count. The two numbers aren’t comparable per square foot without adjusting for this.
Flood and access risk by submarket
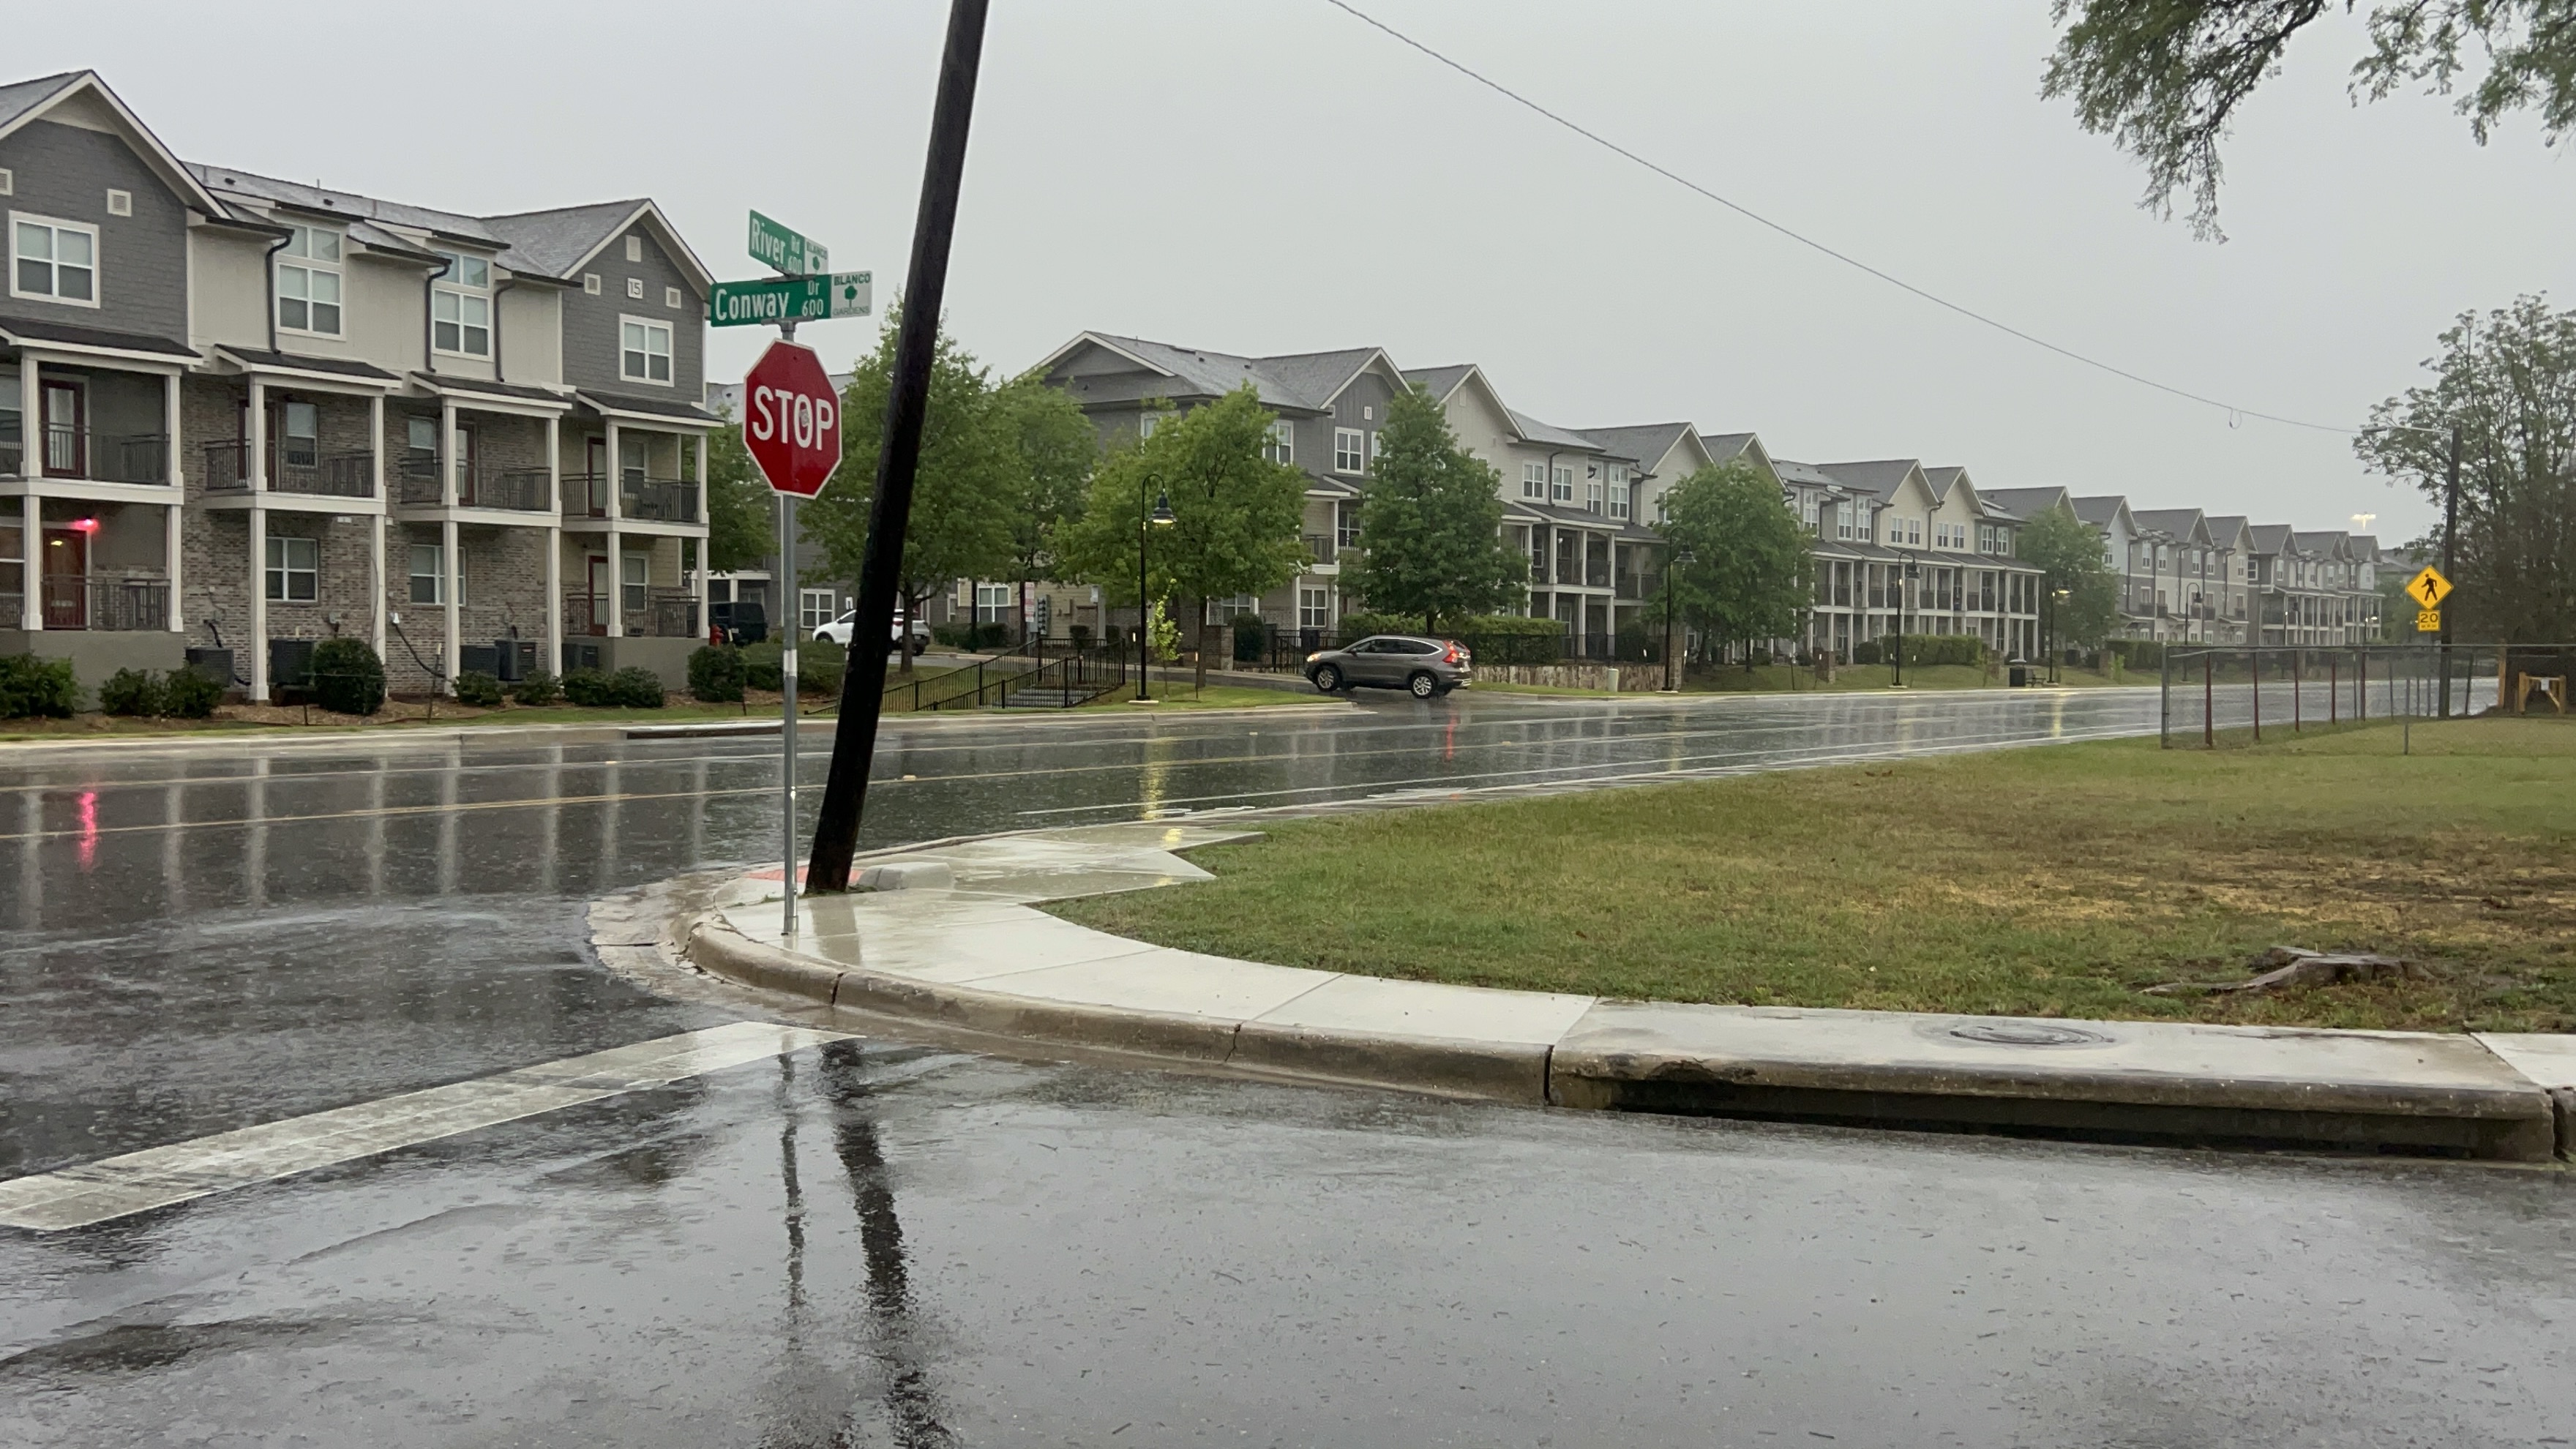
The San Marcos and Blanco Rivers both run through the city, and FEMA’s Physical Map Revision for Hays County – a process the city’s own floodplain page says began in 2016 and reached final maps in January 2025 – covers both waterways plus Purgatory, Sink, Willow Springs, and Cottonwood Creeks. The same city page records that an October 1998 flood covered streets within 30 minutes of forming, and a November 2001 Blanco River flood arrived within an hour of the storm starting.
River-corridor submarkets along Aquarena Springs Drive and the Blanco Gardens/Rio Vista area sit closest to this exposure. I-35-corridor and Wonder World Dr properties generally sit outside the mapped floodway, but that should be confirmed against the current FIRM panel for a specific parcel, not assumed from general distance to the river.
Which San Marcos submarkets have flood risk?The river-corridor submarkets along Aquarena Springs Drive and the Blanco Gardens/Rio Vista area sit closest to the San Marcos and Blanco Rivers, both covered by FEMA’s January 2025 Hays County map revision. A specific parcel’s flood-zone status should be checked against the current FIRM panel rather than assumed from proximity alone.
Why the rent figures disagree
Why do rent averages for San Marcos differ between sites?Apartments.com’s $1,127 figure is a one-bedroom average from its own listing feed with no disclosed sample size. Apartment List’s $1,057 figure is an all-unit median from a dated, named monthly report. Different unit mix and different snapshot dates, not a real price swing, account for most of the gap.
| Source | Reported figure | Date | Methodology note |
|---|---|---|---|
| Apartments.com | $1,127/mo (1BR average) | Live feed, sampled July 2026 | No published sample size or date range on-page |
| Apartment List | $1,057/mo (citywide median, all units) | July 2026 Rent Report | Named, dated, proprietary index |
Comments